Searching Markdown files for internal links and visualising with a Pyvis network graph
Lately I've been trying to improve the internal links on the site to improve the user experience. I wanted to check whether each article links to at least one other relevant article.
I also wanted to understand what my content clusters looked like - the aim is to cover topics with a unique take or that are under-represented so they can help as many people as possible and avoid covering topics that are saturated. This also helps to keep efficient use of my time.
There is a 'related articles' section at the bottom but this works on the category and isn't in the body of the article. The articles are stored in Markdown files in GitHub to keep them backed up and version controlled, so the plan was to:
- Search the Markdown files and extract all internal links using RegEx
- Produce and display a network visualisation to understand content clusters and relationships using Pyvis
Pyvis is a wrapper for the popular visJS JavaScript library, and it allows for easy generation of network graph visuals in Python.
If you want to follow along, a reproducible example can be found in the GitHub repo ready to clone or download. The main Python file is in the /utils folder, and the Markdown files containing internal links are in the /content/blog/ folder.
Install packages
We'll only need to install two libraries, pyvis and pandas, so let's install those.
python -m pip install pyvis pandas
Import libraries
In a new Python file internal_links_graph.py, we'll first import all libraries.
import os
import re
import pandas as pd
from pyvis.network import Network
Searching the Markdown files
Next we need to create the edge data to feed into the network graph, by searching the Markdown files for internal links.
To do that, we need to:
- Define source (page linked from), target (page linked to), and weight (line weight) lists
- Set a regular expression to parse Markdown links
- Loop through and open each file in the given directory path, and for each:
- Grab all links starting with /blog/
- Append these to source, target and weight lists
- Zip the lists together and return
def get_edge_data() -> pd.DataFrame:
    source = []
    target = []
    weight = []
    pages_with_no_internal_links = set()

    count = 0
    path = "../content/blog"
    links_regex = re.compile(r'\[([^\]]+)\]\(([^)]+)\)')

    for filename in os.listdir(path):
        file_path = os.path.join(path, filename)
        name, extension = os.path.splitext(filename)
        count += 1

        try:
            with open(file_path, encoding="utf8") as f:
                md = f.read()
                links = list(links_regex.findall(md))
                links_added = 0

                for link in links:
                    if link[1].startswith("/blog/"):
                        source.append("/blog/" + name + "/")
                        target.append(link[1])
                        weight.append(0.4)
                        links_added += 1

                if links_added == 0:
                    pages_with_no_internal_links.add(name)
        except Exception as error:
            print("An exception occurred:", error)

    print(f"{count} files searched.")

    print(f"{len(source)} sources and {len(target)} targets.", end="\n\n")

    print(f"{len(pages_with_no_internal_links)} pages with no internal links:")

    for link in pages_with_no_internal_links:
        print(link)

    return zip(source, target, weight)
Producing the network graph
Now we have the edge_data of all source and target pages, we can build a network graph to visualise the nodes by:
- Defining a new Network with the given properties
- Add each item in edge_data to as a network node
- Add hover information to each node
- Output the network graph to an HTML file links.html
def display_graph(edge_data) -> None:
    net = Network(height="900px",
                  width="100%",
                  directed=True,
                  bgcolor="#222222",
                  font_color="#b1b4b6",
                  select_menu=True,
                  filter_menu=True,
                  cdn_resources="remote")

    net.show_buttons(filter_=["nodes", "physics"])

    for e in edge_data:
        src = e[0]
        dst = e[1]
        w = e[2]

        net.add_node(src, src, title=src)
        net.add_node(dst, dst, title=dst)
        net.add_edge(src, dst, value=w)

    neighbor_map = net.get_adj_list()

    # add neighbor data to node hover data
    for node in net.nodes:
        node["title"] += " links to:\n" + "\n".join(neighbor_map[node["id"]])
        node["value"] = len(neighbor_map[node["id"]])

    net.show("links.html", notebook=False)
Run the file
Finally, we can add the two function calls to the script to get the edge data and display the graph.
if __name__ == "__main__":
    edge_data = get_edge_data()
    display_graph(edge_data)
To run the program in a new terminal or command line we can use:
python internal_links_graph.py
Full code
"""Searches the Markdown files for internal links in blog articles.

Reads in the all files in the /content/blog directory and then searches for
any link which contains /blog/.

Outputs the results of this to a graph visual 'links.html'

Install packages using `pip install pandas pyvis`
"""
import os
import re
import pandas as pd
from pyvis.network import Network

def get_edge_data() -> pd.DataFrame:
    source = []
    target = []
    weight = []
    pages_with_no_internal_links = set()

    count = 0
    path = "../content/blog"
    links_regex = re.compile(r'\[([^\]]+)\]\(([^)]+)\)')

    for filename in os.listdir(path):
        file_path = os.path.join(path, filename)
        name, extension = os.path.splitext(filename)
        count += 1

        try:
            with open(file_path, encoding="utf8") as f:
                md = f.read()
                links = list(links_regex.findall(md))
                links_added = 0

                for link in links:
                    if link[1].startswith("/blog/"):
                        source.append("/blog/" + name + "/")
                        target.append(link[1])
                        weight.append(0.4)
                        links_added += 1

                if links_added == 0:
                    pages_with_no_internal_links.add(name)
        except Exception as error:
            print("An exception occurred:", error)

    print(f"{count} files searched.")

    print(f"{len(source)} sources and {len(target)} targets.", end="\n\n")

    print(f"{len(pages_with_no_internal_links)} pages with no internal links:")

    for link in pages_with_no_internal_links:
        print(link)

    return zip(source, target, weight)

def display_graph(edge_data) -> None:
    net = Network(height="900px",
                  width="100%",
                  directed=True,
                  bgcolor="#222222",
                  font_color="#b1b4b6",
                  select_menu=True,
                  filter_menu=True,
                  cdn_resources="remote")

    net.show_buttons(filter_=["nodes", "physics"])

    for e in edge_data:
        src = e[0]
        dst = e[1]
        w = e[2]

        net.add_node(src, src, title=src)
        net.add_node(dst, dst, title=dst)
        net.add_edge(src, dst, value=w)

    neighbor_map = net.get_adj_list()

    # add neighbor data to node hover data
    for node in net.nodes:
        node["title"] += " links to:\n" + "\n".join(neighbor_map[node["id"]])
        node["value"] = len(neighbor_map[node["id"]])

    net.show("links.html", notebook=False)

if __name__ == "__main__":
    edge_data = get_edge_data()
    display_graph(edge_data)
What I learnt about the content clusters
The main takeaway from plotting all of the content in a network graph, was that there wasn't enough internal linking throughout the site.
I spent some time to embed relevant content links in other articles and the outcome was a collection of strong content clusters. The clusters included web scraping, automation, data science and analysis, and web app development.
The first image below shows what the network looked like before these improvements, and the second what it looks like now.

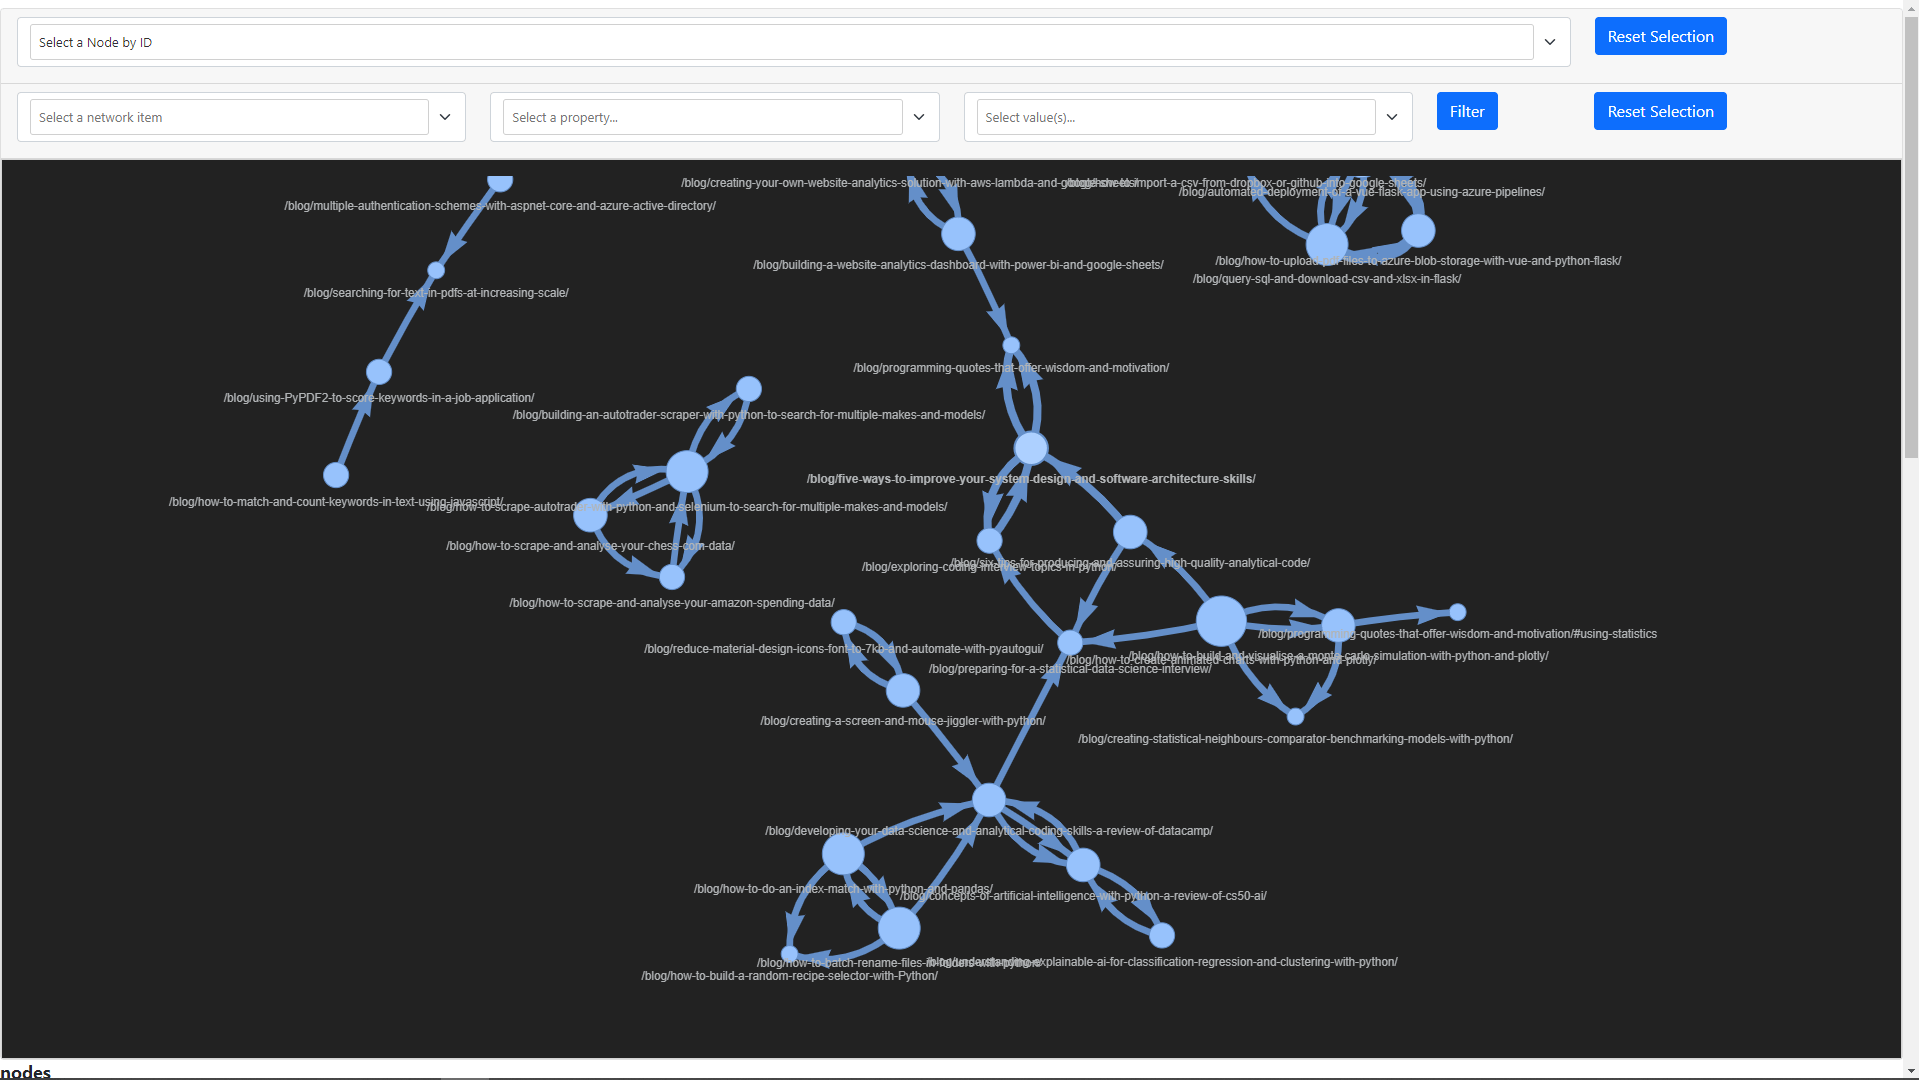
You can see from the HTML file output the network graph can be searched and filtered using the top dropdowns. This is because earlier we passed True to both select_menu and filter_menu when creating the Network object.
The image below shows filtering the example from the GitHub repo by a given path. Very useful for quickly identifying and highlighting nodes in a larger network.

Happy networking
I hope you were able to apply this methodology to your own use case. Although you might not store your content in Markdown, I am sure this could be adapted to search other formats with a similar setup.
Visualising relationships like this through nodes in a network graph is very powerful. It certainly helped to deliver more relevant internal links to articles and visualise the content clusters. Pyvis can also be integrated with NetworkX. NetworkX is a Python package for the creation, manipulation, and study of the structure, dynamics, and functions of complex networks.
If you enjoyed this article be sure to check out other articles on the site 👍 you may be interested in: