How to query a database with Python Flask and download data to CSV or XLSX in Vue
Background
I was recently working on a project building a web app to automate viewing and downloading data. The result was a Vue - Flask app which accepted some user input, and based upon that input, sent the relevant SQL query to a data warehouse. The data could then be viewed or downloaded straight from the browser. There were a multitude of benefits from this. The queries no longer needed to be ran manually, saving time. They were indexed and easily updated. Finally, the data was more accessible via a web app to users without knowledge of SQL.
This article will cover building a simplified version of this app where we’ll go over the following:
- Optional: Setting up an Azure SQL database for testing
- Getting a Vue - Flask app set up from a template
- Creating a SQL query lookup
- Configuring Flask RESTX API endpoints
- Sending an Axios call to get data
- Building a simple form to accept user input
- Presenting the data in the browser
- Adding links to download the data
- Bonus: Displaying the SQL code nicely formatted
You can use this as a starting point to further develop a more complex and tailored solution. You’ll need either your own database set up to follow along, or you can set one up in the optional first step. I’ll be setting up and connecting to an Azure SQL database however it should be adaptable to other databases. You'll also need Python 3.6.x along with Node and Yarn installed.
Optional: Setting up an Azure SQL database for testing
This first step is optional as you might already have your own database you want to connect to. To facilitate an end to end tutorial, I’m setting up an Azure SQL database for testing. You can register for an Azure account which has some services free for 12 months. The video below starts from the Azure portal. It will guide you through the process of setting up an Azure SQL database with a sample AdventureWorks dataset, and find the connection string.
Now make a note of the connection string, we’ll need that later on. It should look something like this.
Driver={ODBC Driver 13 for SQL Server};Server=tcp:test-sql-server-0123.database.windows.net,1433;Database=test-sql-database-01;Uid=AdminUser;Pwd={your_password_here};Encrypt=yes;TrustServerCertificate=no;Connection Timeout=30;
Replace {your_password_here} with the password you created during setting up the SQL database.
Setting up a Vue - Flask project
First things first, head over to this public repository and download the project template. This is a great project template from gtalarico and this will be our starting point. Use whichever editor or IDE you're comfortable with, I'm using Visual Studio Code. The general project structure should look something like this:
flask-vuejs-template-master
│   README.md
|   .flaskenv
|   .gitignore
|   app.json
|   package.json
│   Pipfile
|   Pipfile.lock
|   run.py
|   vue.config.js
|   yarn.lock
|   ...
|
│
└───app
│   │   __init__.py
│   │   client.py
|   |   config.py
│   │
│   └───api
│       │   __init__.py
|       |   resources.py
│       │   security.py
│
└───src
│   │   App.vue
│   │   backend.js
|   |   filters.js
|   |   main.js
|   |   router.js
|   |   store.js
│   │
│   └───assets
│   |   │   ...
│   └───components
│   |   │   HelloWorld.vue
│   └───views
│       │   Api.vue
│       │   Home.vue
The app directory contains the Flask app and the src directory contains the frontend Vue app. We'll now install pipenv, create a virtual environment, install the project packages to it, and activate it. The Pipfile requires Python 3.6, but you should be able to manually change this if you have a different Python version. We'll be installing flask-restx, a community driven fork of Flask-RESTPlus. We'll also be installing pyodbc to connect to the SQL database, xlsxwriter for downloading an excel file and pandas for general dataframe processing.
cd flask-vuejs-template-master
python -m pip install pipenv
python -m pipenv install --dev
python -m pipenv install flask-restx pyodbc xlsxwriter pandas
python -m pipenv shell
Now that the Python packages are installed, let's install and upgrade the Vue dependencies with Yarn, and build the Vue dist directory.
yarn install --dev
yarn upgrade
yarn build
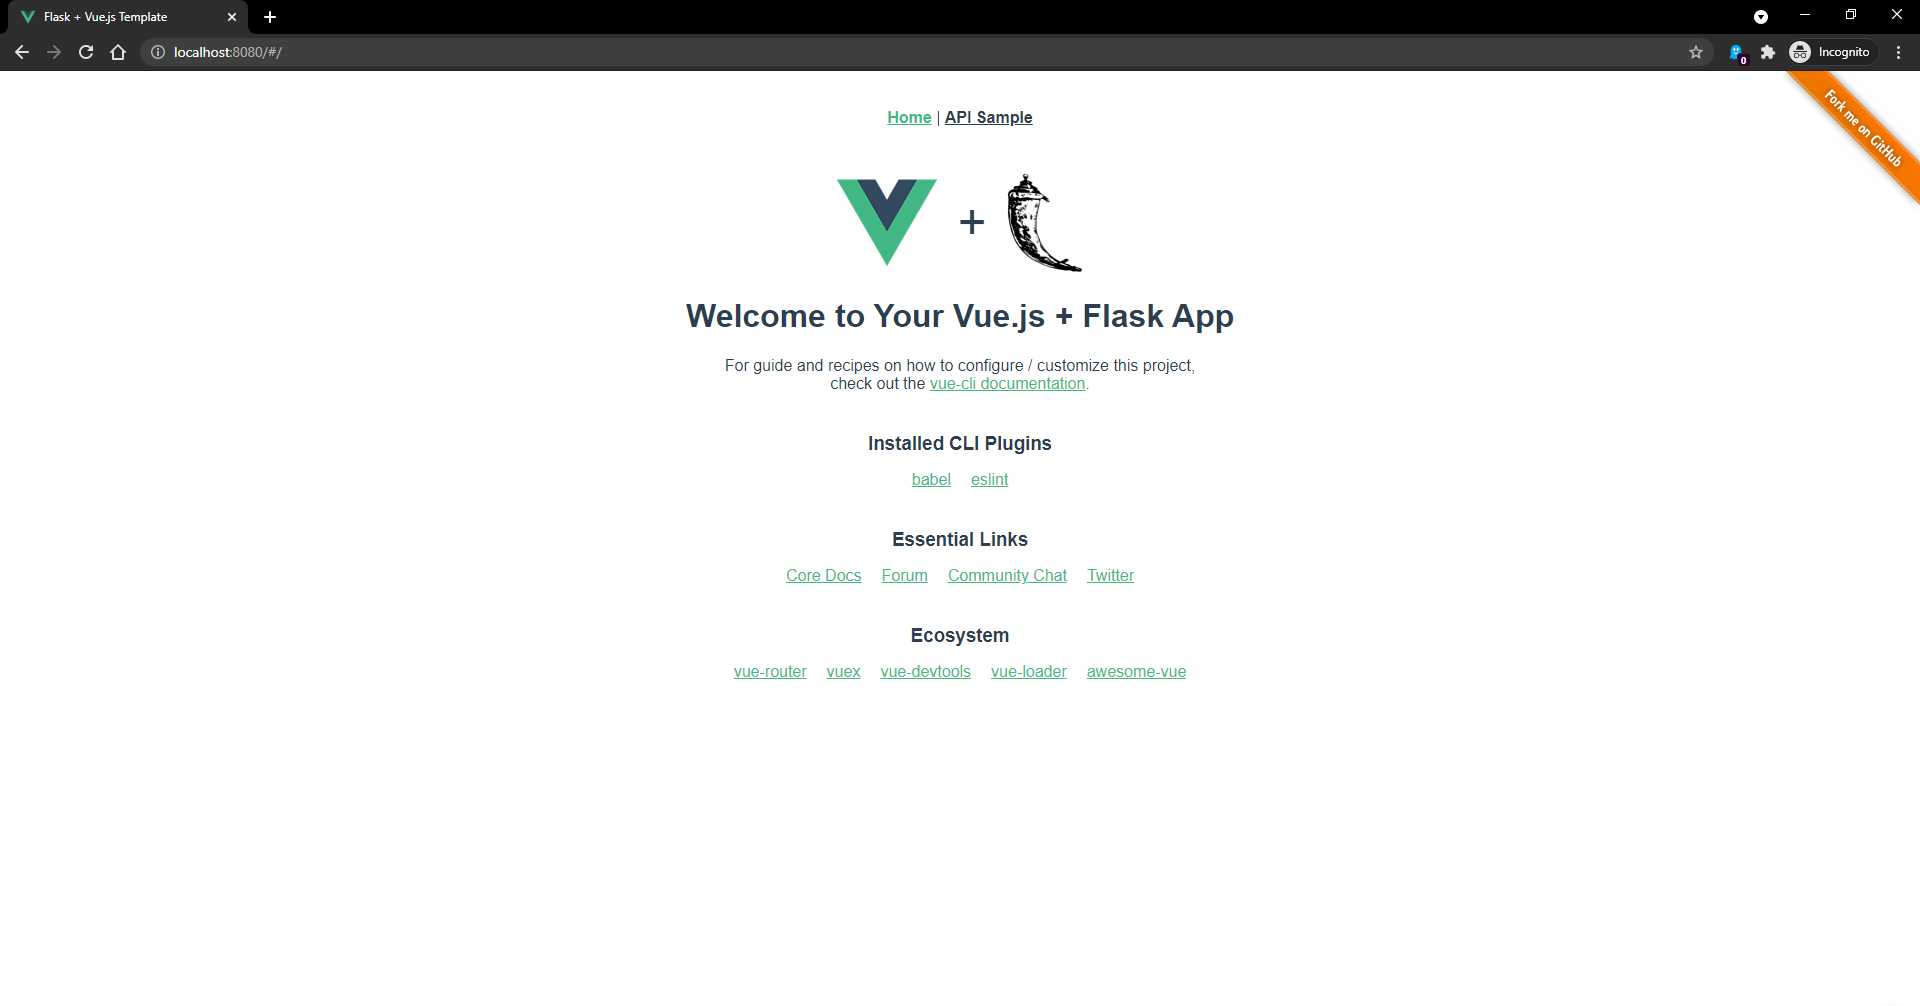
If everything went smoothly, you should be able to run both the backend and frontend dev servers. Run python run.py and from another terminal window in the same directory run yarn serve. You should see the app running at http://localhost:8080/#/.
Creating a SQL query lookup table
Creating a simple lookup table for the SQL queries that the database expects will be useful for later on. Of course, the queries here are specific to the AdventureWorksLT database I’m working with, so feel free to adapt them to yours. Create another folder inside the app folder called data. Then create a lookup.csv file and copy the data below into it. The other columns will map to the user’s input to find their chosen query.
Query,SQL
All customers who live in Canada,"SELECT C.[FirstName],C.[LastName],A.[AddressLine1],A.[CountryRegion]FROM [SalesLT].[Customer] C JOIN [SalesLT].[CustomerAddress] CA ON CA.[CustomerId] = C.[CustomerId] JOIN [SalesLT].[Address] A ON CA.[AddressId] = A.[AddressId] WHERE  A.[CountryRegion] LIKE 'Canada'"
All products ordered by price,"SELECT TOP (1000) [ProductID],[Name],[ProductNumber],[Color],[StandardCost],[ListPrice],[Size],[Weight] FROM [SalesLT].[Product] ORDER BY [ListPrice] DESC"
Total revenue for each product,"SELECT P.Name, SUM(LineTotal) AS TotalRevenue FROM [SalesLT].[SalesOrderDetail] AS SOD JOIN [SalesLT].[Product] AS P ON SOD.[ProductID] = P.[ProductID] GROUP BY P.Name ORDER BY TotalRevenue DESC"
The key thing to note here are the double brackets which escape commas inside the SQL statements.
Configuring Flask API endpoints
Since we’ll be using a Vue single page application, there will need to be endpoints for it to send requests to later on. Let’s get started building these out. Within app/api add a file query.py. This will be our main API route for handling queries. Once the file is created open api/__init__.py and add the .query import just underneath the .resources import, to ensure our new route is registered.
...

# Import resources to ensure view is registered
from .resources import * # NOQA
from .query import *
Now in query.py add two routes, one for getting the data, and one which will download the data.
import os
import io
from flask import request, send_file, make_response
from flask_restx import Resource
from . import api_rest
import pyodbc
import pandas as pd

connection_string = os.getenv("DB_URI")

@api_rest.route('/query/get')
class GetData(Resource):

    def post(self):
        """ Retrieves data from the database """
        # TODO

@api_rest.route('/query/download')
class DownloadData(Resource):

    def post(self):
        """ Returns data as a downloadable file """
        # TODO
Adding an environment variable for DB_URI
As you can see we're ready to hook up the connection string for our database using os.getenv("DB_URI"). The best and most secure way to do that is via an environment variable. This template has the python-dotenv package installed, so we can use a .env file. At the folder top level create a file called .env and add in your own connection string:
DB_URI="DRIVER={ODBC Driver 17 for SQL Server};SERVER=test-sql-server-0123.database.windows.net;DATABASE=test-sql-database-01;UID=AdminUser;PWD={your_password_here}"
Now the environment variable is added, you will have to close your current terminal, start a new one and reactivate the shell with python -m pipenv shell. This should show a message during start saying Loading .env environment variables... so we know they're registered!
Route for getting data
With the connection string ready, let's complete the route for retrieving data from the database. We'll be grabbing the query from the POST request, and then we'll use the lookup file we made earlier to find the correct SQL statement.
@api_rest.route('/query/get')
class GetData(Resource):

    def post(self):
        """ Retrieves data from the database """
        query = request.get_json()['query']

        lookup = pd.read_csv(os.path.join(
            os.getcwd(), "app", "data", "lookup.csv"))

        sql_statement = lookup.loc[lookup["Query"] == query, "SQL"].iloc[0]

        conn = pyodbc.connect(connection_string)
        dataframe = pd.read_sql(sql_statement, conn)
        conn.close()

        return {
          "sql_statement": sql_statement,
          "data": dataframe.to_json()
        }
Route for downloading data
Next we'll complete the route which will query the database and return a downloadable file in either CSV or XLSX format.
@api_rest.route('/query/download')
class DownloadData(Resource):

    def post(self):
        """ Returns data as a downloadable file """
        file_type = request.get_json()['fileType']
        query = request.get_json()['query']

        lookup = pd.read_csv(os.path.join(
            os.getcwd(), "app", "data", "lookup.csv"))

        sql_statement = lookup.loc[lookup["Query"] == query, "SQL"].iloc[0]

        conn = pyodbc.connect(connection_string)
        dataframe = pd.read_sql(sql_statement, conn)
        conn.close()

        if file_type == "csv":
          response = make_response(dataframe.to_csv(index=False))
          response.headers["Content-Disposition"] = "attachment; filename=data.csv"
          response.headers["Content-Type"] = "text/csv"

          return response
        elif file_type == "xlsx":
          bytes_stream = io.BytesIO()

          writer = pd.ExcelWriter(bytes_stream, mode="w", engine="xlsxwriter")
          dataframe.to_excel(writer, startrow=0, merge_cells=False,
                            sheet_name="Sheet_1", index_label=None, index=False)
          writer.save()

          bytes_stream.seek(0)

          return send_file(bytes_stream,
                          attachment_filename="data.xlsx",
                          mimetype="application/vnd.openxmlformats-officedocument.spreadsheetml.sheet",
                          as_attachment=True)
Now with the endpoints built we can call them from the Vue app using Axios.
Sending an Axios request to get data
Open up src/components/HelloWorld.vue and delete everything so we can start from a blank template.
<template>
  <div>
    <h1>Select your query</h1>
    <div>
      <select v-model="selectedQuery">
        <option disabled value="">Please select a query</option>
        <option>All customers who live in Canada</option>
        <option>All products ordered by price</option>
        <option>Total revenue for each product</option>
      </select>
      <button v-on:click="getData()">Get data!</button>
    </div>
    <div v-if="dataframe">
      {{ dataframe }}
      <button v-on:click="downloadData('csv')">Download data to CSV</button>
      <button v-on:click="downloadData('xlsx')">Download data to XLSX</button>
    </div>
  </div>
</template>

<script>
import axios from 'axios';

export default {
  data() {
    return {
      selectedQuery: null,
      dataframe: null,
      sqlStatement: null
    }
  },
  methods: {
    getData() {
      // TO DO
    },
    downloadData() {
      // TO DO
    }
  }
}
</script>
Get data method
    getData() {
      axios.post(`api/query/get`, { query: String(this.selectedQuery) })
        .then(response => {
          this.sqlStatement = response.data.sql_statement;
          this.dataframe = JSON.parse(response.data.data);
        })
    },
Download data method
    downloadData(fileType) {
      axios.post(`api/query/download`, {
        fileType: fileType
      }, {
        responseType: fileType === "csv" ? "text" : "arraybuffer"
      })
        .then(response => {
          let filename = response.headers["content-disposition"].split("filename=")[1];

          if (fileType === "csv") {
            const csv = response.data;
            const link = document.createElement("a");
            link.target = "_blank";
            link.href = "data:text/csv;charset=utf-8," + encodeURIComponent(csv);
            link.download = filename;
            link.click();
          }

          if (fileType === "xlsx") {
            const blob = new Blob([response.data], { type: 'application/vnd.openxmlformats-officedocument.spreadsheetml.sheet' });
            const url = window.URL.createObjectURL(blob);
            const link = document.createElement("a");
            link.target = "_blank";
            link.href = url;
            link.download = filename;
            link.click();
            window.URL.revokeObjectURL(url);
          }
        })
        .catch(error => console.log(error));
    }
You should now see data on the page after selecting an option and clicking the get data button. It might not look too good just yet, but it will soon. Now we have the Axios calls working and ready to go, we can improve the UI and render the data to a table.
Viewing the data in a table and downloading
To improve the UI and display the returned data in a table, let's install Buefy, which has lightweight UI components for Vue.js based on Bulma.
yarn add buefy
With Buefy installed, initialise it within src/main.js:
import Vue from 'vue'
import App from './App.vue'
import router from './router'
import store from './store'
import Buefy from 'buefy'
import 'buefy/dist/buefy.css'
import './filters'

Vue.use(Buefy)

Vue.config.productionTip = false

new Vue({
  router,
  store,
  render: h => h(App)
}).$mount('#app')
Here is the revised HelloWorld.vue component to improve the UI and display our data in a table!
<template>
  <div class="columns is-mobile is-centered">
    <div class="column is-half">
      <div>
        <b-field label="Select your query">
          <b-select v-model="selectedQuery" placeholder="Choose a query">
            <option disabled value="">Please select a query</option>
            <option>All customers who live in Canada</option>
            <option>All products ordered by price</option>
            <option>Total revenue for each product</option>
          </b-select>
        </b-field>
        <div class="buttons is-centered">
          <b-button v-on:click="getData()" type="is-primary">
            Get data
          </b-button>
        </div>
      </div>
      <div v-if="rows">
        <b-table
          :data="rows"
          :columns="columns"
          :sticky-header="true"
          height="600px"
        ></b-table>
        <div class="buttons is-centered mt-5">
          <b-button v-on:click="downloadData('csv')" type="is-primary">
            Download data to CSV
          </b-button>
          <b-button v-on:click="downloadData('xlsx')" type="is-primary">
            Download data to XLSX
          </b-button>
        </div>
      </div>
    </div>
  </div>
</template>

<script>
import axios from "axios";

export default {
  data() {
    return {
      selectedQuery: null,
      dataframe: null,
      sqlStatement: null,
    };
  },
  methods: {
    getData() {
      // Already implemented
    },
    downloadData(fileType) {
      // Already implemented
    },
    /**
     * Retrieves column names from the dataset.
     *
     * @param {Object} data
     * @return {Object} Object containing dataset rows.
     */
    getColumns(data) {
      let columns = Object.keys(data);
      return columns.map((name) => ({
        field: name,
        label: name,
      }));
    },
    /**
     * Transforms dataset into an object of row-data.
     *
     * @param {Object} data
     * @return {Object} Object containing dataset rows.
     */
    getRows(data) {
      let rows = [];
      let numberOfRows = this.getRowCount(data);
      let index = this.getStartIndex(data);

      for (let i = 0; i < numberOfRows; i++, index++) {
        let row = {};
        for (let col in data) {
          row[col] = data[col][index];
        }
        rows.push(row);
      }
      return rows;
    },
    /**
     * Counts the rows in each column and returns max count
     *
     * @param {Object} data
     * @return {Number} Count of rows
     */
    getRowCount(data) {
      let rowsInColumns = [];
      for (let col in data) {
        let rows = Object.keys(data[col]).length;
        rowsInColumns.push(rows);
      }
      return Math.max.apply(null, rowsInColumns);
    },
    /**
     * Gets the start index for the dataset
     *
     * @param {Object} data
     * @return {Number} Start index
     */
    getStartIndex(data) {
      for (let prop in data) {
        let column = data[prop];
        for (let row in column) {
          return row;
        }
        break;
      }
    },
  },
  computed: {
    rows() {
      if (this.dataframe) {
        return this.getRows(this.dataframe);
      }
    },
    columns() {
      if (this.dataframe) {
        return this.getColumns(this.dataframe);
      }
    }
  }
};
</script>
I've added helper methods to wrangle the returned data so it can be used with the table component. The table component expects a column prop as an array of column objects, and a data prop as an array of row objects.
So effectively we transform something like this:
{
   "Name": {
      "0":"Touring-1000 Blue, 60",
      "1":"Mountain-200 Black, 42",
      "2":"Road-350-W Yellow, 48",
      "3":"Mountain-200 Black, 38",
      "4":"Touring-1000 Yellow, 60",
      "5":"Touring-1000 Blue, 50",
   },
   "TotalRevenue": {
      "0":37191.492,
      "1":37178.838,
      "2":36486.2355,
      "3":35801.844,
      "4":23413.474656,
      "5":22887.072
   }
}
... into something like this:
[
  {
    "Name":"Touring-1000 Blue, 60",
    "TotalRevenue":37191.492
  },
  {
    "Name":"Mountain-200 Black, 42",
    "TotalRevenue":37178.838
  },
  {
    "Name":"Road-350-W Yellow, 48",
    "TotalRevenue":36486.2355
  },
  {
    "Name":"Mountain-200 Black, 38",
    "TotalRevenue":35801.844
  },
  {
    "Name":"Touring-1000 Yellow, 60",
    "TotalRevenue":23413.474656
  }
]
You should now see the data rendered in the table and two buttons at the bottom to download it in either CSV or XLSX format. Both use cases are now fulfilled! Great job if you made it this far!
Bonus: Displaying the SQL query nicely formatted
What if a more advanced user is interested in what underlying SQL query was executed based upon their selections? That was the reason I added the query from the lookup to the JSON response, so it would be available for this last nice to have! I came across a package recently sql-formatter that formats SQL for easier reading. Using this package with prism, not only will the SQL be formatted but also have syntax highlighting. First to install and configure both.
yarn add sql-formatter prismjs
Now these two packages are ready to go, add the SQL query underneath the download buttons, import both packages and they should handle the rest.
          ...
          <b-button v-on:click="downloadData('xlsx')" type="is-primary">
            Download data to XLSX
          </b-button>
        </div>
      </div>
      <div v-show="sqlStatement">
        <h2 class="is-size-5 mt-5">View the SQL statement this query</h2>
        <pre class="language-sql" style="font-size: 16px">
          <code v-html="'\n' + sqlStatement">
          </code>
        </pre>
      </div>
    </div>
  </div>
</template>

<script>
import axios from "axios";
import { format } from 'sql-formatter';
import Prism from 'prismjs';
import 'prismjs/themes/prism.css';
import 'prismjs/components/prism-sql';

export default {
  data() {
    return {
      selectedQuery: null,
      dataframe: null,
      sqlStatement: null,
    };
  },
  updated() {
    Prism.highlightAll();
  },
  methods: {
    getData() {
      axios
        .post(`api/query/get`, { query: String(this.selectedQuery) })
        .then((response) => {
          this.sqlStatement = format(response.data.sql_statement, {
            language: "tsql",
            uppercase: true
          });
          this.dataframe = JSON.parse(response.data.data);
        });
    },
    ...
  }
}
</script>
As you can see I've wrapped the returned response.data.sql_statement with the format function and added Prism.highlightAll() to the updated lifecycle hook - so everytime the DOM updates it will highlight the new query!
Demonstration and next steps
Here is a video of the completed project in action. It’s a simplified version of the app I worked on, however you should see the potential to make this your own and introduce additional functionalities.
I hope you enjoyed this end to end project, let me know in the comments if you have any questions or if you've adapted this to your own needs. I think this is a very popular use case that can automate manual queries and put data in the hands of people who don’t know much SQL - they will certainly thank you for opening that door up for them! In terms of next steps and ideas for further development I suggest:
- Make the code more modular and introduce a service layer
- Generate the Form options dynamically from the SQL lookup sheet
- Pull the SQL lookup file from cloud storage like S3, Google Cloud Storage or Azure blob storage (allows admin to upload a new version with new queries easily)
- Deploying this app to a cloud hosting platform like AWS or Azure
- Adding user authentication if required
- Designing and improving the UI (this tutorial was more focused on functionality than UI design)
- Expanding the range of queries available
- Building dynamic queries into the app including where and group by clauses (always be aware of what SQL you’re allowing the user to execute to avoid SQL injection attacks)
- Connecting to multiple databases
- Adding a 'copy code' to clipboard button
If you enjoyed this article be sure to check out other articles on the site 👍 you may be interested in: