Creating statistical neighbours comparator benchmarking models with Python

This article will explore how to get started creating a statistical neighbours model to benchmark, compare and find similar observations within a dataset. This might be comparing the sales of a store, to only other stores that are statistically similar in terms of size, budget and staffing or comparing school attendance performance for a given area to only other areas of similar size, pupil numbers and other characteristics.
The main problem of comparator models is how to define what is considered statistically 'similar'. We will explore two approaches to solving this problem.
All of the data used in this article is not real data. It has been adapted and modified based upon real data sources for learning purposes.
Filtering approach
In this dummy dataset school_data.xlsx I adapted from two good open data sources Explore education statistics and Get Information about Schools there are around 1,800 schools but we only want to compare a school's attendance levels to it's top ten most statistically similar in terms of pupil size, alongside FSM and SEN characteristics.
| School | Attendance% | Pupils | FSM | SEN | Phase | LocationID |
|---|---|---|---|---|---|---|
| SCHOOL-0001 | 98.2 | 63 | 5 | 6 | PHASE-1 | 855 |
| SCHOOL-0002 | 81 | 1229 | 257 | 72 | PHASE-2 | 873 |
| SCHOOL-0003 | 94.8 | 250 | 10 | 16 | PHASE-1 | 891 |
| SCHOOL-0004 | 94.5 | 653 | 78 | 89 | PHASE-1 | 856 |
| SCHOOL-0005 | 93.9 | 463 | 83 | 45 | PHASE-1 | 866 |
| SCHOOL-0006 | 94.2 | 918 | 156 | 131 | PHASE-2 | 865 |
| SCHOOL-0007 | 0 | 81 | 25 | 18 | PHASE-2 | 888 |
| SCHOOL-0008 | 91.4 | 195 | 83 | 29 | PHASE-1 | 888 |
| SCHOOL-0009 | 96.5 | 223 | 89 | 63 | PHASE-1 | 888 |
| SCHOOL-0010 | 92.5 | 719 | 253 | 130 | PHASE-2 | 209 |
| ... | ... | ... | ... | ... | ... | ... |
For each school, we will apply a series of filters to find it's top ten comparators in terms of both pupil size and characteristics like FSM and SEN.
"""
A model to identify school comparator's based on their size and
characteristics in order to compare attendance performance.
Assumptions:
- Schools will only be compared to schools of the same phase type.
- Results will be the top ten statistically closest schools.
- The comparators will be based on attendance %.
Functionality:
- Ability to compare against schools of a similar size.
- Ability to compare against schools with similar characteristics
"""
import os
import time
import pandas as pd
def get_data() -> pd.DataFrame():
"""
Reads the Excel dataset into a Pandas DataFrame and adds new features such
as %FSM and %SEN.
"""
df = pd.read_excel("school_data.xlsx")
df["Attendance%"] = df["Attendance%"] * 100
df["%FSM"] = (df["FSM"] / df["Pupils"]) * 100
df["%SEN"] = (df["SEN"] / df["Pupils"]) * 100
return df
def generate_all_comparators(output_all_to_csv: bool = False) -> None:
"""
Generates the top 10 comparators for every school in the dataset, for each
of the 2 comparator groups (size, characteristics).
Optionally saves the result to CSV files where the folder name is the name
of the school where output_all_to_csv is set to True.
"""
df = get_data()
df_length = len(df)
comparator_mappings = []
for index, row in df.iterrows():
school_name = row["SchoolName"]
similar_sized_comparators = find_similar_sized_comparators(
school_name=school_name,
df=df
)
similar_characteristics_comparators = find_similar_characteristics_comparators(
school_name=school_name,
df=df
)
add_comparators_to_mappings(
comparators=similar_sized_comparators,
mappings=comparator_mappings,
school_name=school_name,
grouping="Size"
)
add_comparators_to_mappings(
comparators=similar_characteristics_comparators,
mappings=comparator_mappings,
school_name=school_name,
grouping="Characteristics"
)
if output_all_to_csv:
if not os.path.exists("output"):
os.mkdir("output")
school_name = school_name.replace("/", "")
directory = f"output/{school_name}"
if not os.path.exists(directory):
os.mkdir(directory)
similar_sized_comparators.drop(
columns=["Unnamed: 0"], inplace=True)
similar_characteristics_comparators.drop(
columns=["Unnamed: 0"], inplace=True)
similar_sized_comparators.to_csv(
directory + "/similar_sized_comparators.csv",
index=False
)
similar_characteristics_comparators.to_csv(
directory + "/similar_characteristics_comparators.csv",
index=False
)
print(f"{index + 1} of {df_length} done.")
return pd.DataFrame.from_records(comparator_mappings)
def add_comparators_to_mappings(comparators,
mappings,
school_name,
grouping) -> None:
"""
Builds the final output by adding all of the comparators from
the size and characteristics DataFrames to the mapping list
in JSON / dictionary format:
[
{
"School": "A",
"Comparator": "B",
"Grouping": "Size"
},
{
"School": "B",
"Comparator": "C",
"Grouping": "Characteristics"
},
]
Which results in the final output:
School Comparator Grouping
A B Size
A D Size
B D Characteristics
Avoids adding the target school_name as it's own comparator.
"""
for index, row in comparators.iterrows():
comparator_school_name = row["SchoolName"]
if comparator_school_name != school_name:
mappings.append({
"School": school_name,
"Comparator": comparator_school_name,
"Grouping": grouping
})
def find_similar_sized_comparators(school_name: str, df: pd.DataFrame) -> pd.DataFrame:
"""
Finds schools of a similar size and returns as comparators.
This comparator is calculated by the total number of pupils in each school,
per organisation type. The groupings for each organisation type will be
calculated based on the highest and lowest pupil count for schools in that
category i.e. within a given % threshold
"""
school = df[df["SchoolName"] == school_name]
school_size = school["Pupils"].values[0]
school_type = school["Phase"].values[0]
schools_with_same_type = df[df["Phase"] == school_type]
upper_size_threshold = school_size * 1.25
lower_size_threshold = school_size * 0.75
schools_of_similar_size = schools_with_same_type[
(schools_with_same_type["Pupils"] >= lower_size_threshold) &
(schools_with_same_type["Pupils"] <= upper_size_threshold)
].copy(deep=True)
schools_of_similar_size["Size difference"] = (abs(
schools_of_similar_size["Pupils"] -
school_size
))
schools_of_similar_size = schools_of_similar_size.nsmallest(
11, "Size difference")
schools_of_similar_size["Rank"] = (
schools_of_similar_size["Attendance%"].rank(
ascending=False
)
)
return schools_of_similar_size
def find_similar_characteristics_comparators(school_name: str, df: pd.DataFrame) -> pd.DataFrame:
"""
Finds schools with similar %FSM and %SEN characteristics and returns as comparators.
"""
school = df[df["SchoolName"] == school_name]
school_type = school["Phase"].values[0]
school_fsm_percentage = school["%FSM"].values[0]
school_sen_percentage = school["%SEN"].values[0]
schools_with_same_type = df[df["Phase"] == school_type]
upper_fsm_threshold = school_fsm_percentage * 1.1
lower_fsm_threshold = school_fsm_percentage * 0.9
upper_sen_threshold = school_sen_percentage * 1.1
lower_fsm_threshold = school_sen_percentage * 0.9
schools_with_similar_characteristics = schools_with_same_type[
(schools_with_same_type["%FSM"] >= lower_fsm_threshold) &
(schools_with_same_type["%FSM"] <= upper_fsm_threshold) &
(schools_with_same_type["%SEN"] >= lower_fsm_threshold) &
(schools_with_same_type["%SEN"] <= upper_sen_threshold)
].copy(deep=True)
schools_with_similar_characteristics["Characteristics difference"] = (
abs(schools_with_similar_characteristics["%FSM"] - school_fsm_percentage) +
abs(schools_with_similar_characteristics["%SEN"] -
school_sen_percentage)
)
schools_with_similar_characteristics = schools_with_similar_characteristics.nsmallest(
11,
"Characteristics difference"
)
schools_with_similar_characteristics["Rank"] = (
schools_with_similar_characteristics["Attendance%"].rank(
ascending=False
)
)
return schools_with_similar_characteristics
if __name__ == "__main__":
start = time.time()
output = generate_all_comparators(
output_all_to_csv=True
)
output.to_csv("output/comparator-mappings.csv", index=False)
end = time.time()
print(f"Model finished in {round(end - start, 2)} seconds.")
If the output_all_to_csv flag is set to True then for each school a folder will be created in the output directory for it, containing all of it's comparators for both size and pupil characteristics. An example of one of these outputs for 'SCHOOL-005' can be seen in the image below.
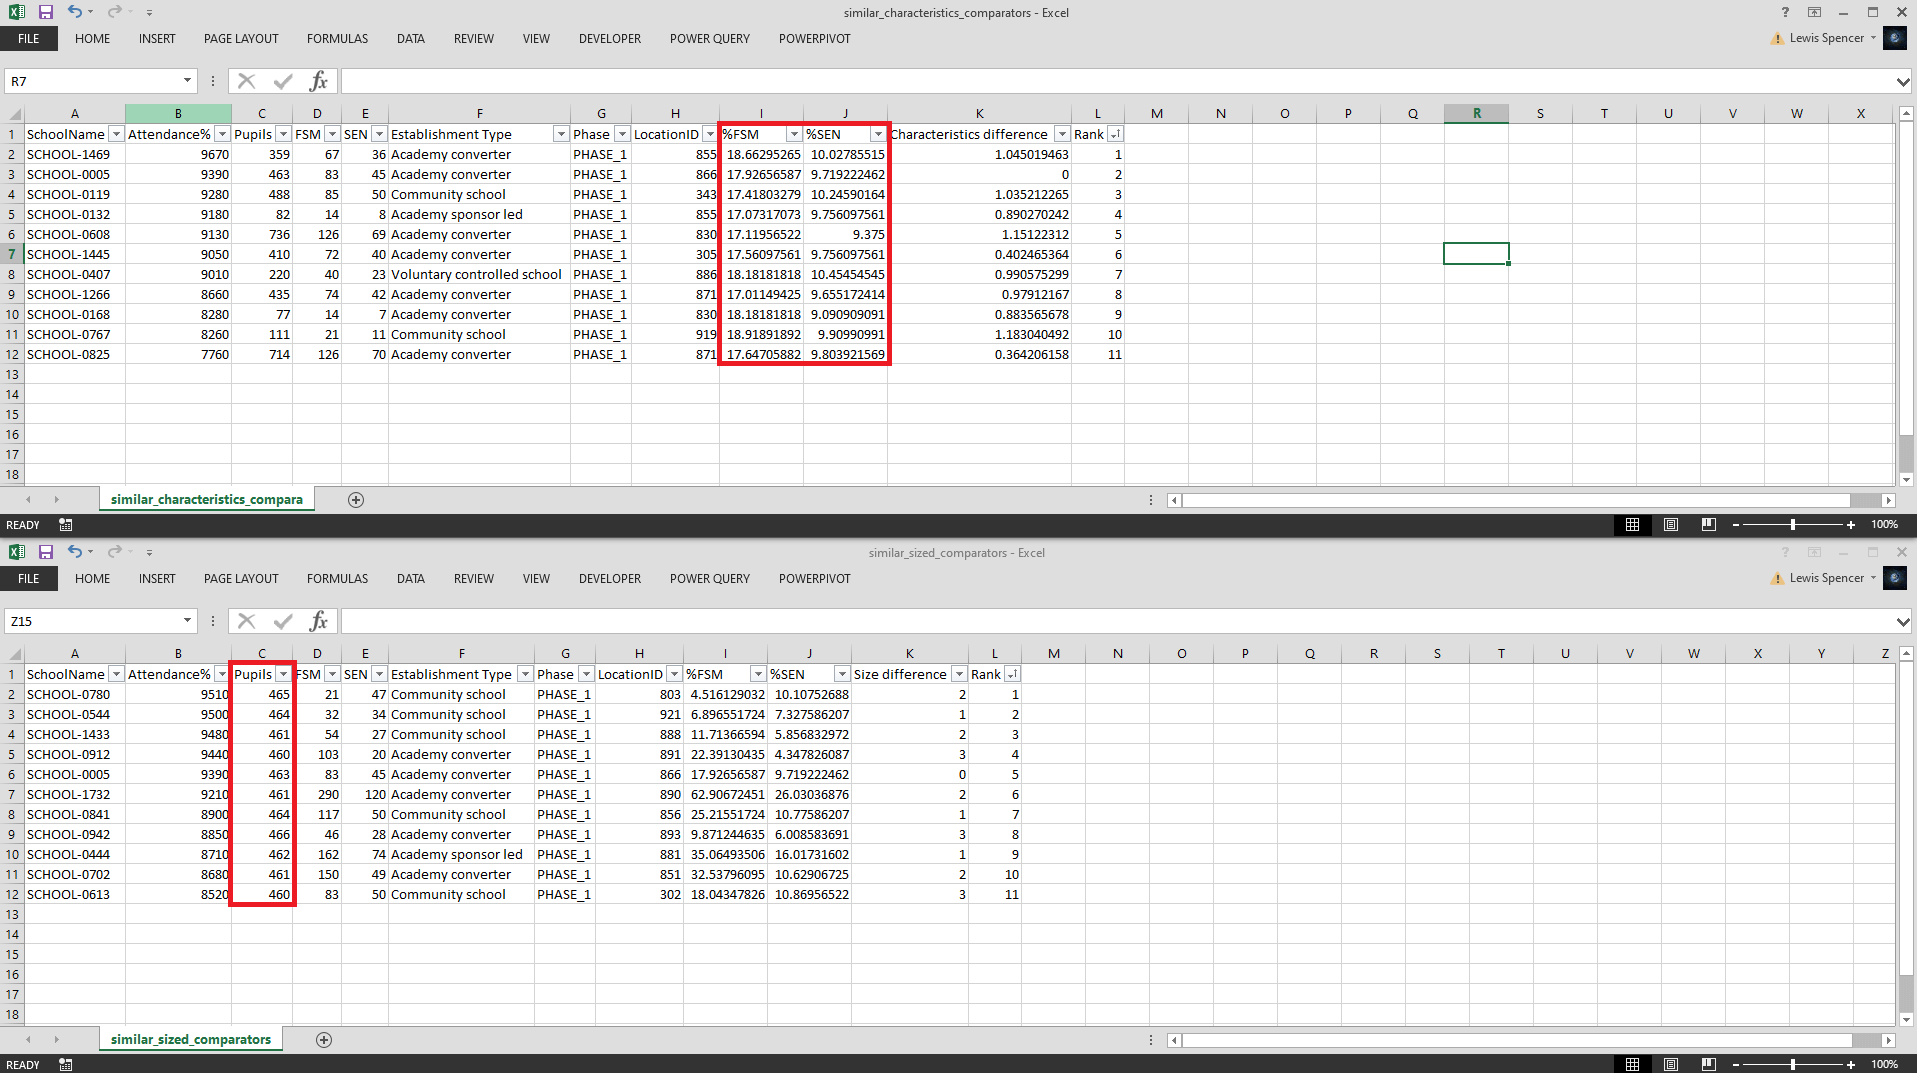
We can see within similar_characteristics_comparators.csv the %FSM and %SEN are within the upper and lower thresholds and within similar_size_comparators.csv Pupils are within the upper and lower thresholds. This shows the model is accurately filtering and ranking only those observations that fit inside these parameters.
Within the output directory, there is also the full list of comparators in the comparator-mappings.csv file.

If we also had columns for 'Easting' and 'Northing' for these schools, we could also add another filter to find the top ten geospatially closest schools.
from scipy.spatial import distance

def find_similar_location_comparators(school_name: str, df: pd.DataFrame) -> pd.DataFrame:
    """
    Finds schools which are geospatially closest and returns as comparators.
    """
    school = df[df["School"] == school_name]
    school_location_id = school["LocationID"].values[0]
    school_type = school["Phase"].values[0]
    schools_with_same_type = df[df["Phase"] == school_type]
    school_easting = school["Easting"].values[0]
    school_northing = school["Northing"].values[0]

    location_data_available = (
        (school_easting != 0) &
        (school_northing != 0)
    )

    if location_data_available:
        geo_comparators = schools_with_same_type \
            .copy(deep=True) \
            .reset_index()

        distances = []

        for _, row in geo_comparators.iterrows():
            a = (school_easting, school_northing)
            b = (row["Easting"], row["Northing"])
            distances.append(
                distance.euclidean(a, b)
            )

        geo_comparators["distance"] = pd.Series(distances)
        geo_comparators = geo_comparators[
            geo_comparators["Phase"] == school_type
        ]
        geo_comparators = geo_comparators.sort_values(
            by="distance",
            ascending=True
        )
        geo_comparators = geo_comparators.head(11)

        return geo_comparators

    schools_in_same_area = schools_with_same_type[
        (schools_with_same_type["LocationID"] == school_location_id)
    ].copy(deep=True)

    if len(schools_in_same_area) <= 11:
        return schools_in_same_area


    sample =  schools_in_same_area.sample(n=10)
    sample = sample.append(school)

    return sample
Scoring approach
In the next example, our dummy dataset la_data.csv (adapted from a dataset taken from the ONS) is at Local Authority (area) level.
| Local Authority District code (2019) | Local Authority District name (2019) | Profile | Rural-urban classification | Deprivation gap (percentage points) | Deprivation gap % | Deprivation gap ranking | Moran's I | Moran's I ranking | Income deprivation rate | Income deprivation rate ranking | Income deprivation rate quintile | % of households with 3 or more children | School pupils | School attendance % | Schools total spending £ | School spend per pupil £ | School Free School Meal % |
|---|---|---|---|---|---|---|---|---|---|---|---|---|---|---|---|---|---|
| E07000223 | Adur | n-shape | Urban with City and Town | 21.70% | 21.70 | 233 | 0.17 | 234 | 10.80% | 158 | 3 | 10 | 37437 | 76 | 307104 | 8.20 | 28.70 |
| E07000026 | Allerdale | Flat | Mainly Rural (rural including hub towns >=80%) | 36.60% | 36.60 | 95 | 0.29 | 157 | 12.10% | 130 | 3 | 16 | 40461 | 69 | 869572 | 21.49 | 43.60 |
| E07000032 | Amber Valley | n-shape | Urban with Minor Conurbation | 32.90% | 32.90 | 121 | 0.29 | 157 | 10.90% | 153 | 3 | 6 | 22981 | 44 | 652505 | 28.39 | 39.90 |
| E07000224 | Arun | n-shape | Urban with City and Town | 28.70% | 28.70 | 164 | 0.31 | 139 | 10.40% | 171 | 3 | 25 | 34449 | 64 | 437529 | 12.70 | 35.70 |
| E07000170 | Ashfield | More income deprived | Urban with City and Town | 36.00% | 36.00 | 98 | 0.15 | 246 | 15.20% | 72 | 2 | 11 | 9366 | 50 | 770050 | 82.22 | 43.00 |
| E07000105 | Ashford | n-shape | Urban with Significant Rural (rural including hub towns 26-49%) | 29.10% | 29.10 | 160 | 0.34 | 116 | 11.00% | 150 | 3 | 26 | 38834 | 71 | 613225 | 15.79 | 36.10 |
| E07000004 | Aylesbury Vale | Less income deprived | Largely Rural (rural including hub towns 50-79%) | 19.60% | 19.60 | 264 | 0.47 | 55 | 6.70% | 272 | 5 | 22 | 38433 | 56 | 609848 | 15.87 | 26.60 |
| E07000200 | Babergh | Less income deprived | Mainly Rural (rural including hub towns >=80%) | 16.90% | 16.90 | 280 | 0.17 | 234 | 8.00% | 232 | 4 | 21 | 48694 | 53 | 146570 | 3.01 | 23.90 |
| E09000002 | Barking and Dagenham | More income deprived | Urban with Major Conurbation | 25.40% | 25.40 | 195 | 0.27 | 175 | 19.40% | 20 | 1 | 21 | 36548 | 89 | 326135 | 8.92 | 32.40 |
| E09000003 | Barnet | n-shape | Urban with Major Conurbation | 31.90% | 31.90 | 132 | 0.36 | 105 | 11.10% | 148 | 3 | 15 | 48851 | 33 | 448473 | 9.18 | 38.90 |
We want to compare a Local Authority area to only other statistically similar areas, but not just on one factor, but many (or all) numeric factors available and score them in terms of 'closeness'. This will find the top ten closest neighbours for comparisons and benchmarking.
import pandas as pd


def find_statistical_neighbours_for(local_authority_district_code: str) -> pd.DataFrame:
    df = pd.read_csv(
        filepath_or_buffer="la_data.csv",
        encoding="cp1252"
    )

    df["Comparator score"] = 0
    df["Comparator variables"] = ""

    target_la = df.loc[
        (df["Local Authority District code (2019)"] == local_authority_district_code)
    ]

    comparison_variables = {
       "Deprivation gap %": 1,
       "Deprivation gap ranking": 1,
       "Moran's I ranking": 1,
       "Income deprivation %": 1,
       "Income deprivation rate ranking": 1,
       "% of households with 3 or more children ": 1,
       "School pupils": 2,
       "School Free School Meal %": 2
    }

    # compare the comparator variables for each LA against the target LA and score them
    for index, row in df.iterrows():
        is_target_la = (
            row["Local Authority District code (2019)"] == local_authority_district_code
        )

        if is_target_la:
            continue

        for variable in comparison_variables:
            if variables_are_statistically_similar(target_la[variable].values[0], row[variable]):
                df.loc[index, 'Comparator score'] = (
                    df.loc[index, 'Comparator score'] + comparison_variables[variable]
                )

                df.loc[index, 'Comparator variables'] = (
                    df.loc[index, 'Comparator variables'] + variable + ", "
                )


    return(df.nlargest(10, "Comparator score").append(target_la))


def variables_are_statistically_similar(target: float, comparator: float) -> bool:
    upper_bound = target * 1.10
    lower_bound = target * 0.90

    comparator_is_within_range = (
        comparator > lower_bound and comparator < upper_bound
    )

    return comparator_is_within_range


def print_attendance_comparisons(df: pd.DataFrame) -> None:
    target_la = df.iloc[-1]
    df = df[: -1]

    la_name = target_la["Local Authority District name (2019)"]
    la_school_attendance_percentage = target_la["School attendance %"]

    average_comparator_attendance_percentage = df["School attendance %"].mean()

    print("The average school attendance percentage of your comparator LAs was ", end="")
    print(f"{average_comparator_attendance_percentage}%", end="\n")
    print(f"School attendance in {la_name} was {la_school_attendance_percentage}%", end="\n")

    attendance_percentage_difference = (
        la_school_attendance_percentage - average_comparator_attendance_percentage
    )
    attendance_percentage_difference = round(abs(attendance_percentage_difference), 2)

    if la_school_attendance_percentage < average_comparator_attendance_percentage:
        print(
            f"This is {attendance_percentage_difference} "
            f"percentage points lower than your comparator LAs"
        )
    else:
        print(
            f"This is {attendance_percentage_difference} "
            f"percentage points higher than your comparator LAs"
        )


def print_spending_comparisons(df: pd.DataFrame) -> None:
    target_la = df.iloc[-1]
    df = df[: -1]

    la_name = target_la["Local Authority District name (2019)"]
    la_school_spending = target_la["Schools total spending £"]

    average_comparator_spending = df["Schools total spending £"].mean()

    print("", end="\n\n")

    print("The average school spending of your comparator LAs was ", end="")
    print(f"£{average_comparator_spending}", end="\n")
    print(f"School spending in {la_name} was £{la_school_spending}", end="\n")

    spending_difference = (
        la_school_spending - average_comparator_spending
    )
    spending_difference = round(abs(spending_difference), 2)

    if la_school_spending < average_comparator_spending:
        print(f"This is £{spending_difference} lower than your comparator LAs")
    else:
        print(f"This is £{spending_difference} higher than your comparator LAs")


if __name__ == "__main__":
    comparators = find_statistical_neighbours_for("E07000150")

    print_attendance_comparisons(comparators)
    print_spending_comparisons(comparators)

    html_file = open("index.html", "w")
    html_file.write(comparators.to_html())
    html_file.close()
The scoring model works by first assigning weights in the dictionary comparison_variables. Then later will check each of these to see if the variables_are_statistically_similar() against the target Local Authority, and if so, increment the score by the weight for each.
The scoring model then first prints some summary information to the console such as comparisons between the target Local Authority's average attendance and average spending against their comparator Local Authorities. It then outputs the comparators for the target Local Authority to a HTML file 'output.html' to see which has the highest score.
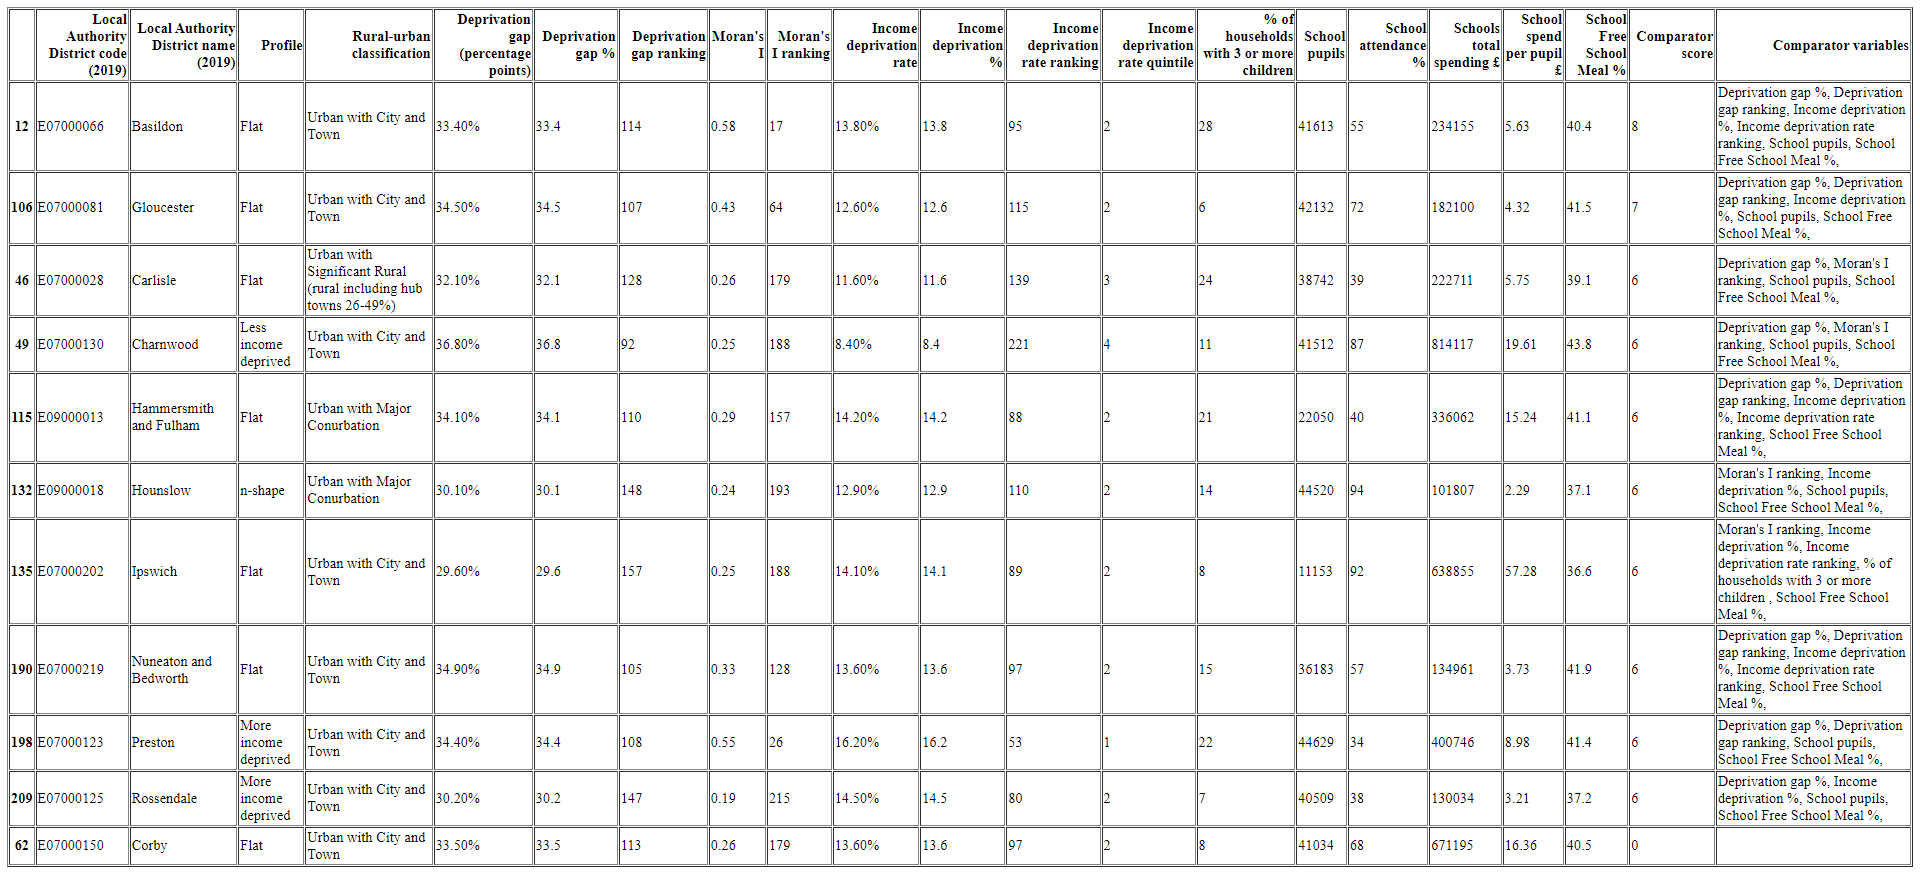
The output could be made to look a little nicer with some styling via CSS, but it clearly shows that across all of the comparison variables which are the 'closest' and even has a column 'Comparator variables' to show which variables were the ones driving those scores.
The target Local Authority (in this example Corby) is at the bottom of the table to refer back to. Go ahead and try plugging in different Local Authority District Codes to the find_statistical_neighbours_for(local_authority_district_code: str) function to see how it performs!
What we learned
We have covered using both filtering and scoring approaches to solving statistical neighbour problems. You can now apply these models to other problems in different domains. It is a very useful ability to only compare to other observations that are statistically similar - it makes the comparison analysis more tailored and as a result the conclusions and decisions are more relevant.
Much better to compare and benchmark observations against those with similar characteristics, else you may end up making decisions that don't really apply to the school, local authority, store, or anything else the observation may be!
I did use mostly an iterative approach whilst putting these solutions together, like looping over DataFrame rows for example. If you can think of more efficient ways to solve these statistical neighbour problems for larger datasets or have any other comparator techniques you would like to share, please post a comment in the comment section below!
As always, if you liked this article please check out other articles on the site.