How to do an index match with Python and Pandas

Inspired by my previous article How to batch rename files in folders with Python and the theme of quickly solving problems with Python, let's explore how make life easier and do an index match using Pandas rather than with Excel. The code and files used are available to download via a link at the end of the article 😄
Index Match with Excel
Let's say we have three tables, Orders, OrderDetails and Products. All of these tables are related by either OrderID or ProductID. A typical problem might be trying to add the ProductName and TotalPrice column values to OrderDetails like this...
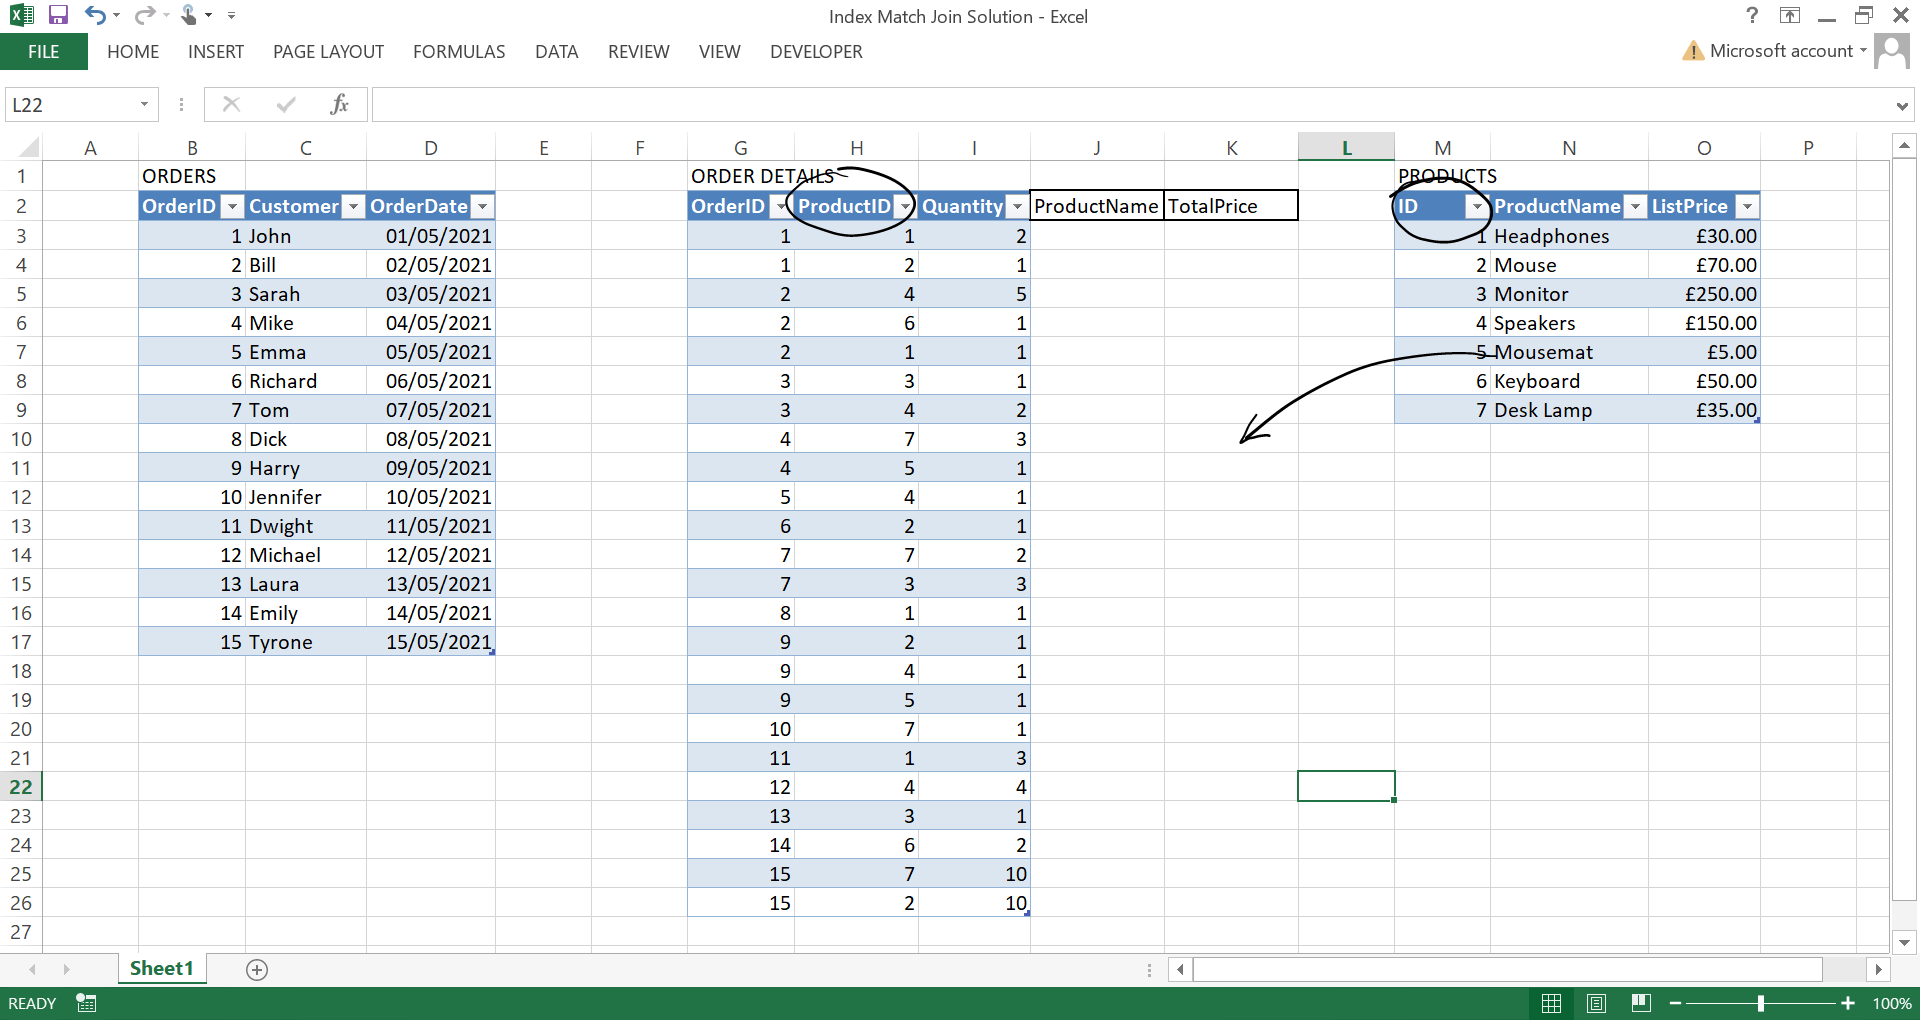
Here we are effectively trying to merge / match the values based upon the ProductID column from the OrderDetails table and the ID column from the Products table.
Using the INDEX MATCH formula in Excel has become the better option vs VLOOKUP due to it not breaking if new columns are inserted.
=INDEX(TargetArray, MATCH(LookupValue, LookupArray, ExactMatch=0))
As we can see, the ProductName and TotalPrice (ListPrice * Quantity) have been filled after dragging the formula downwards.
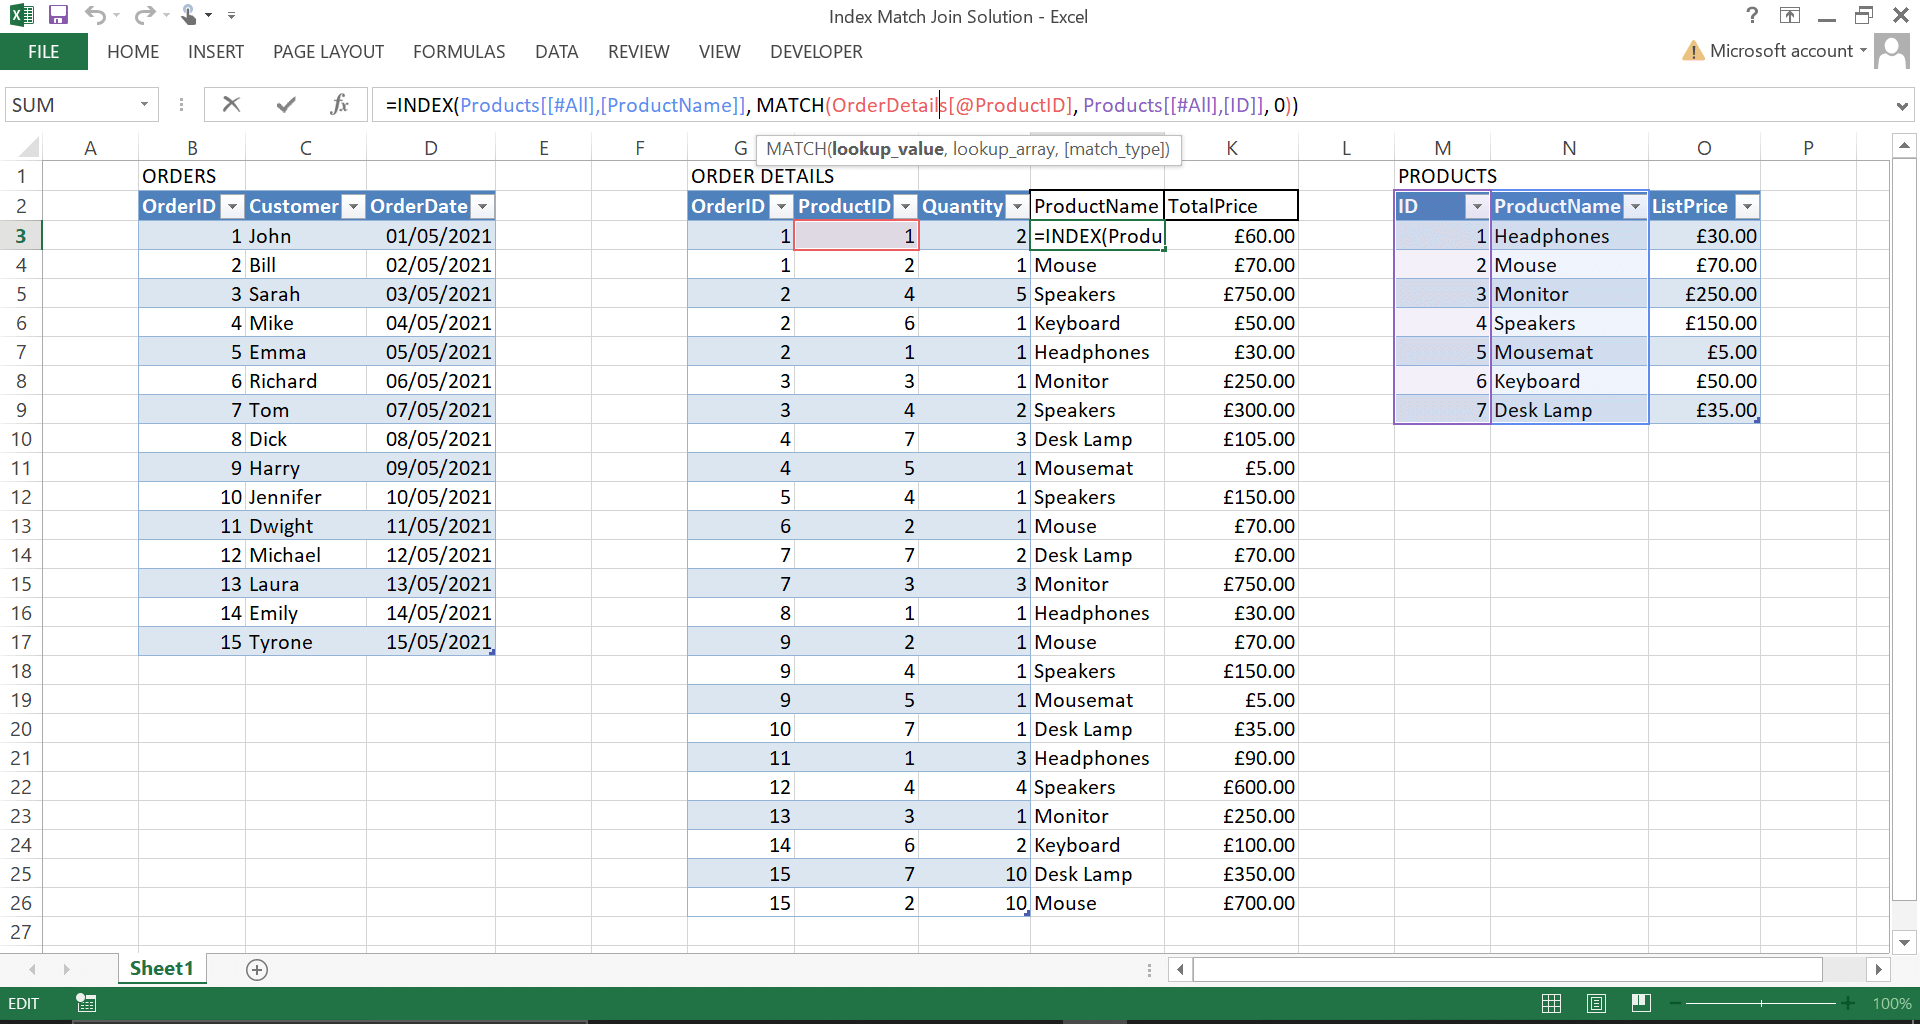
Although I am using a formatted table (using Ctrl + T) in this example, you could also use this without formatted tables by amending the index match formula, but remembering to include the $ for fixed references to the TargetArray and the LookupArray.
=INDEX($N$2:$N$9, MATCH(H3, $M$2:$M$9, 0))
Merge with Python and Pandas
We're now going to try and do the same thing, but this time using Pandas. We're going to use Pandas merge. We'll need a few packages for working with Excel and of course Pandas itself.
pip install numpy pandas openpyxl xlrd
Before running this script, I placed each table into it's own sheet within the 'Index Match Python Problem.xlsx' workbook.
import pandas as pd

excel_file = pd.ExcelFile("Index Match Python Problem.xlsx")
orders = pd.read_excel(excel_file, sheet_name="Orders")
order_details = pd.read_excel(excel_file, sheet_name="OrderDetails")
products = pd.read_excel(excel_file, sheet_name="Products")

df = pd.merge(
    left=order_details,
    right=products,
    left_on="ProductID",
    right_on="ID",
    how="inner"
)

df["TotalPrice"] = df["ListPrice"] * df["Quantity"]
df.to_csv("outputs/merge-output.csv", index=False)
We read in each sheet from the Excel workbook, merge the OrderDetails with the Products table on the ProductID and ID columns, then calculate TotalPrice and output to CSV.
If the ID columns were named the same, we could have just used the on= argument, however left_on= and right_on= allows us to specify different column names to merge on. By also using the how= argument we can specify what kind of merge we want to perform. For those familiar with SQL JOINs, here we are using an inner join, which is the most common generally. For those unfamiliar, I find this Visual JOIN a great way to understand what's happening. You can also see a summary of each in the table below.
| Join Type | Description |
|---|---|
| inner | selects records that have matching values in both dataframes. |
| left | returns all records from the left dataframe, and the matching records from the right dataframe. The result is null records from the right side, if there is no match. |
| right | returns all records from the right dataframe, and the matching records from the left dataframe. The result is null records from the left side, if there is no match. |
| outer | returns all records when there is a match in left or right dataframe records. |
| cross | returns cartesian product of both dataframes (number of rows in the first dataframe multiplied by the number of rows in the second dataframe). |
Be aware cross merges can result in very large result sets, you also don't need the on= argument, since both tables are merged on every record.
This script produces the CSV we can see below in the output folder.
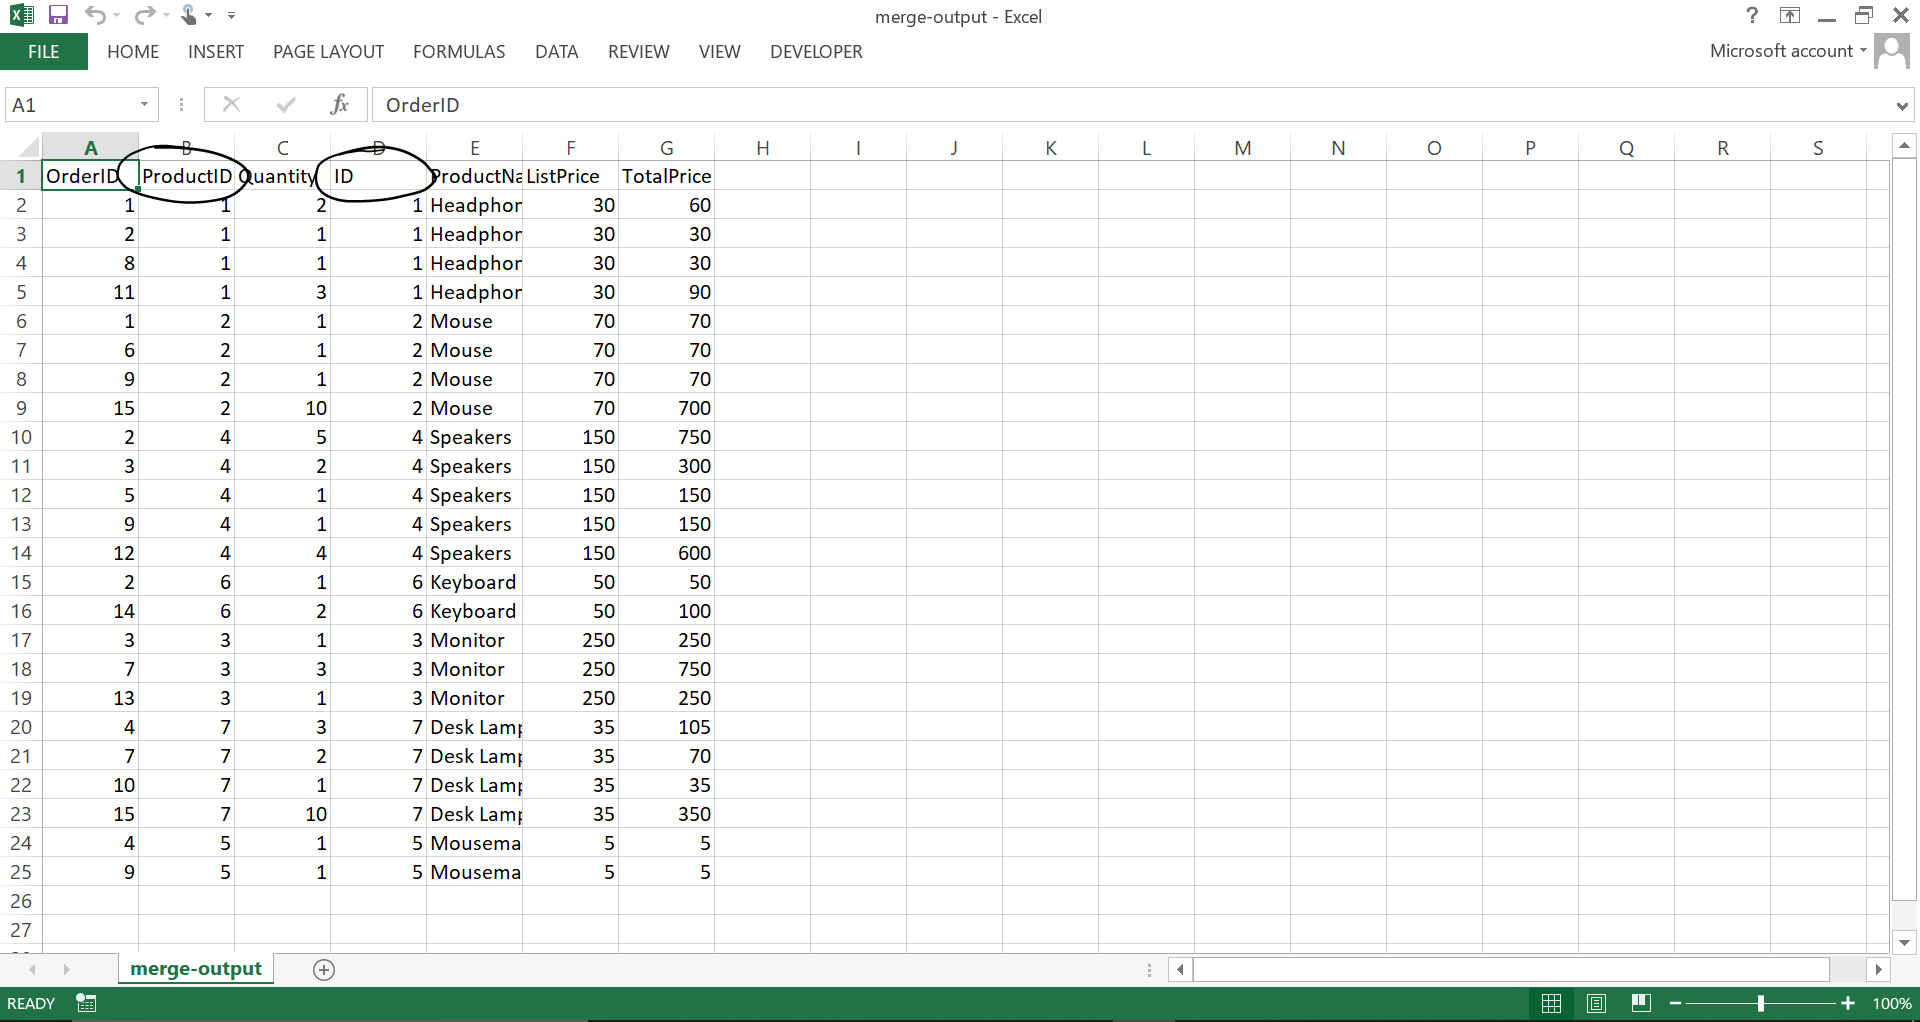
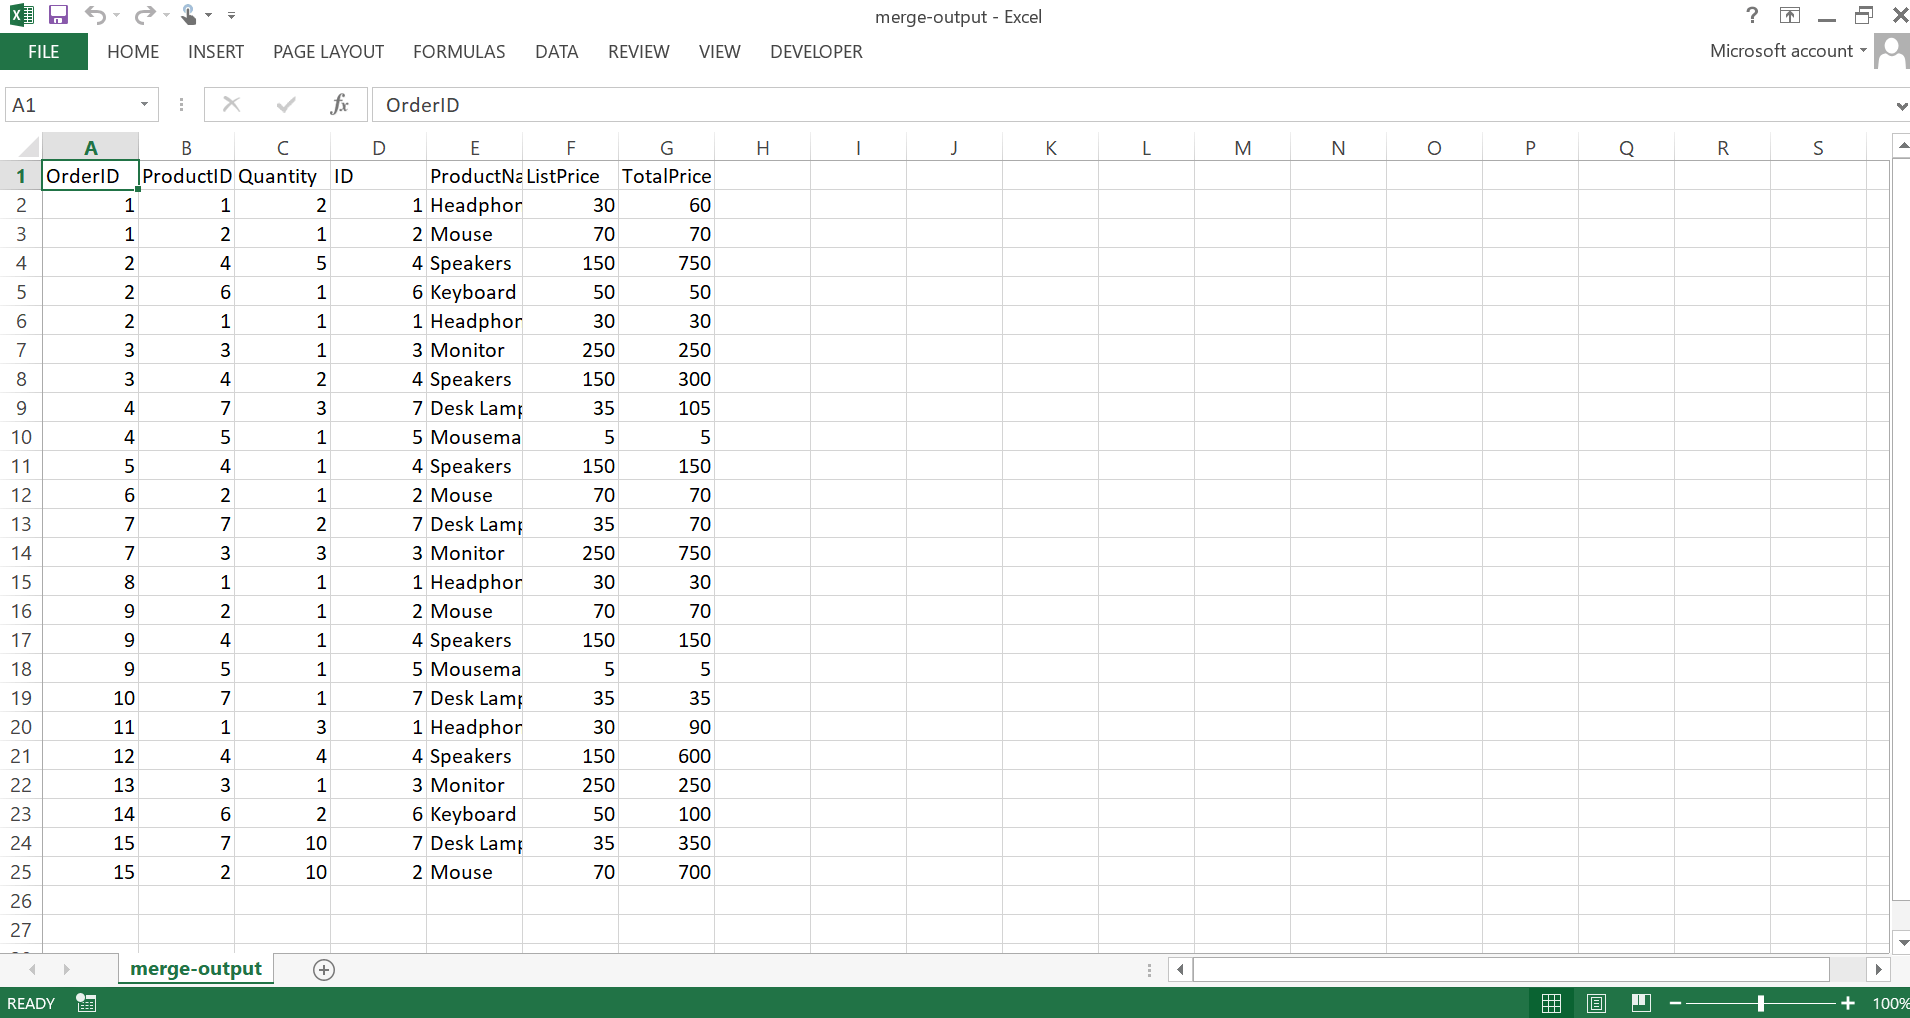
All done! We have the output for OrderDetails showing the ProductName and TotalPrice. You might notice that this isn't sorted the same way as in our original Excel file. This is because by using an inner merge, we are using intersection of keys from both dataframes (ProductID and ID). We can change this to a 'left' merge to use only the keys from the left dataframe.
df = pd.merge(
    left=order_details,
    right=products,
    left_on="ProductID",
    right_on="ID",
    how="left"
)
If you want to try out a 'right' merge, I added a Product called 'Robot' in 'Index Match Python Problem.xlsx' that isn't included in any orders so wouldn't show up using a left or inner join as there is no match.
If you wanted to drop any unneeded columns, like the ID and ListPrice columns from the right dataframe you can add a line before outputting to CSV.
df.drop(columns=["ID", "ListPrice"], axis=1, inplace=True)
Merging multiple tables
Using the same dataset, we will now look at a more advanced example to demonstrate the power of merging. We'll write a function to retrieve order information for a given OrderID and CustomerName. This merges together all tables Orders, OrderDetails and Products.
import pandas as pd

def load_data():
    excel_file = pd.ExcelFile("Index Match Python Problem.xlsx")
    orders = pd.read_excel(excel_file, sheet_name="Orders")
    order_details = pd.read_excel(excel_file, sheet_name="OrderDetails")
    products = pd.read_excel(excel_file, sheet_name="Products")

    return orders, order_details, products


def get_order_information(id, customer_name):
    orders, order_details, products = load_data()

    order = orders.loc[
        (orders['OrderID'] == id) &
        (orders['Customer'] == customer_name)
    ]

    order_info = pd.merge(
        left=order,
        right=order_details,
        on="OrderID",
        how="inner"
    )

    order_info = pd.merge(
        left=order_info,
        right=products,
        left_on="ProductID",
        right_on="ID"
    )

    order_info["TotalPrice"] = order_info["ListPrice"] * order_info["Quantity"]
    order_info.drop(columns=["ID", "ListPrice"], inplace=True)
    products = order_info.groupby(["OrderID"])["ProductName"].agg(list)

    order_info = order_info \
        .groupby(["OrderID", "Customer"])['ProductName', 'TotalPrice'].agg(sum) \
        .reset_index()

    order_info["Products"] = products.values

    print(order_info)

    order_info.to_csv(f"outputs/order-information-for-id-{id}.csv", index=False)


if __name__ == "__main__":
    get_order_information(id=4, customer_name="Mike")
We load the dataframes, use loc to find the rows in OrderDetails where where OrderID and Customer is a match with the inputs giving us the order itself. We inner merge order with order_details, then merge that with products. We calculate TotalPrice, drop any columns not required, and aggregate the products into a list. Finally, we group by the OrderID and calculate the sum of each OrderDetail, and add the Products for the order.
Going back to verify we can see for OrderID 4, Mike did indeed purchase three Desk Lamps and a Mousemat for a combined total of £110! He must really like Desk Lamps!
This is a script I will keep coming back to, as it provides so many useful things you might want to do. Particularly if you don't necessarily want to merge you just want to 'lookup' or 'filter' the dataframe by one or more criteria - for this example we filtered on both OrderID and Customer name to demonstrate. The line using loc can be applied to other datasets to achieve this. You can also filter without using loc like in the alternative below but this post explains why it might be better to use it.
order = orders[
  (orders["OrderID"] == id) &
  (orders["Customer"] == customer_name)
]
We could also do something like this to lookup a single value like the name of the customer for the given OrderID.
orders, order_details, products = load_data()
customer_name = orders.at[orders.loc[orders["OrderID"] == 4].index[0], "Customer"]
print(customer_name)
An alternative to Pandas merge is to use join which is very similar. The Pandas documentation gives a comparison for those who wish to learn more.
Bonus: Stacking multiple tables
As a bonus, what if we're not trying to merge multiple tables, but stack multiple tables? First of all, this is what I mean by stack. Let's say you have two or more tables that all need 'stacking' on top of one another.
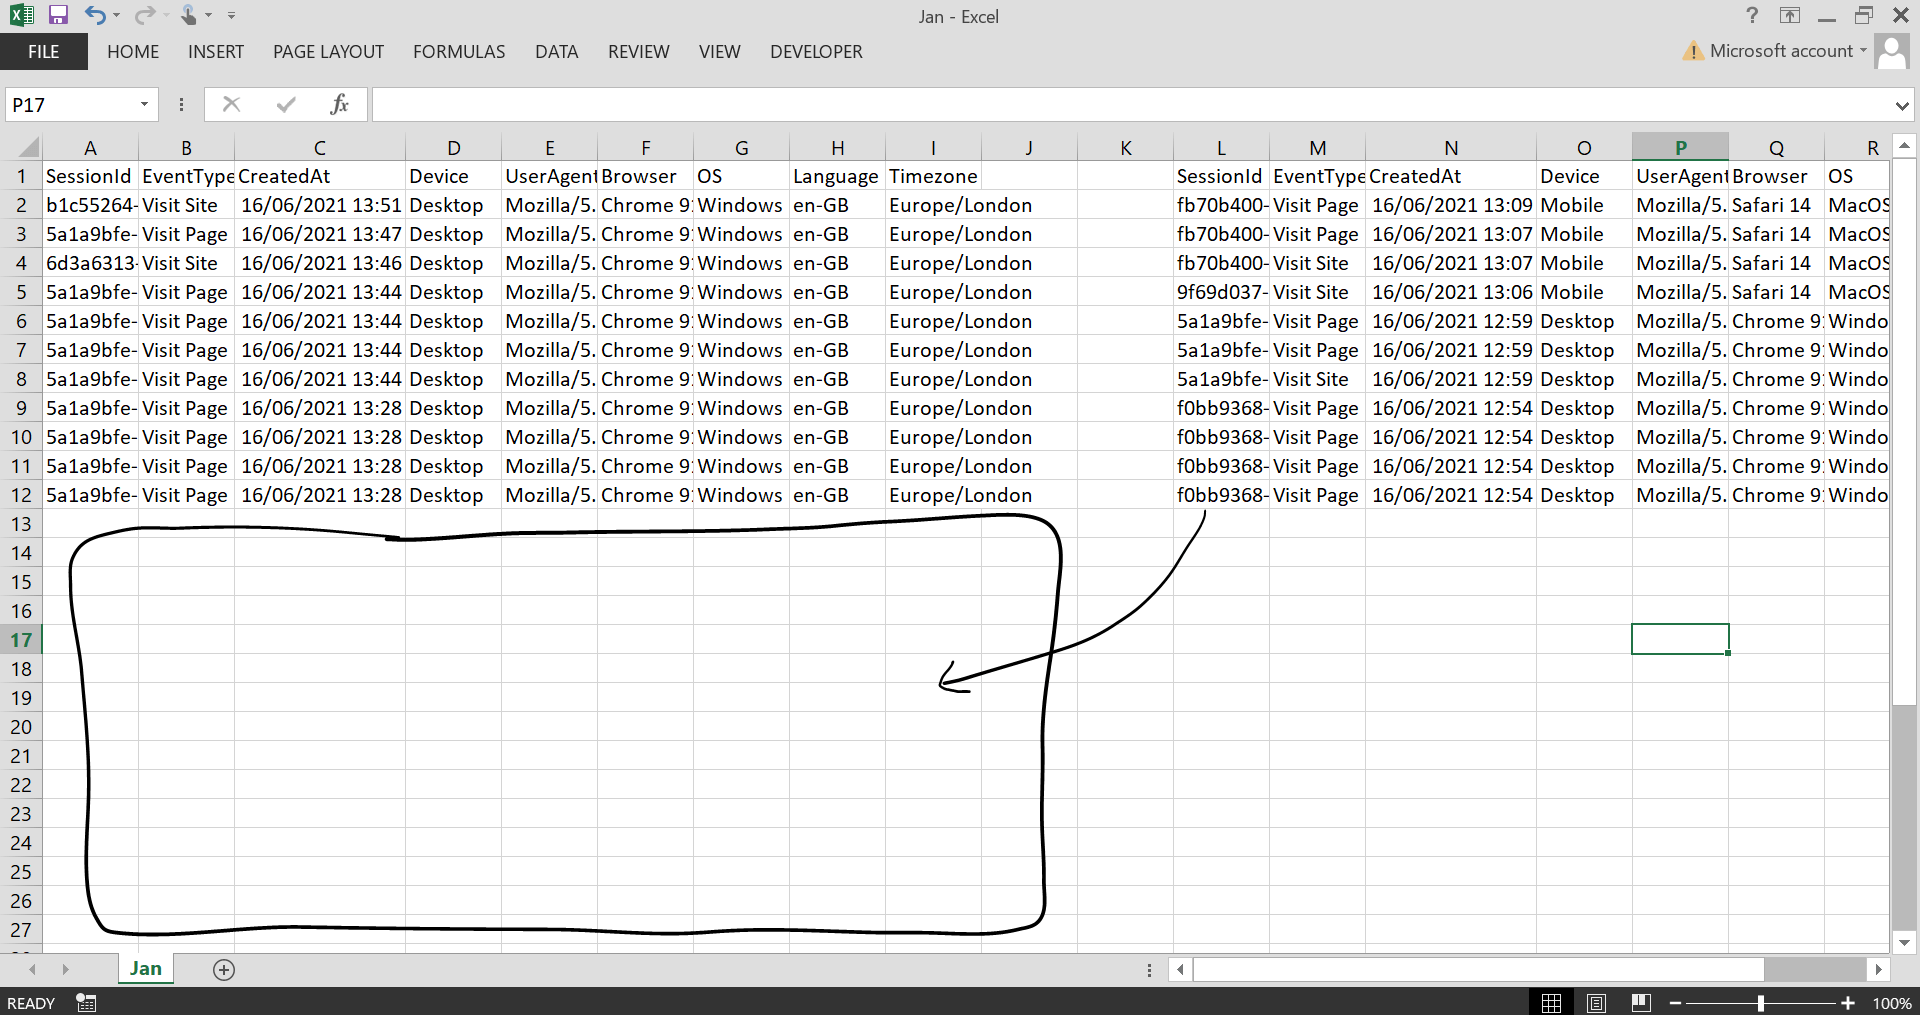
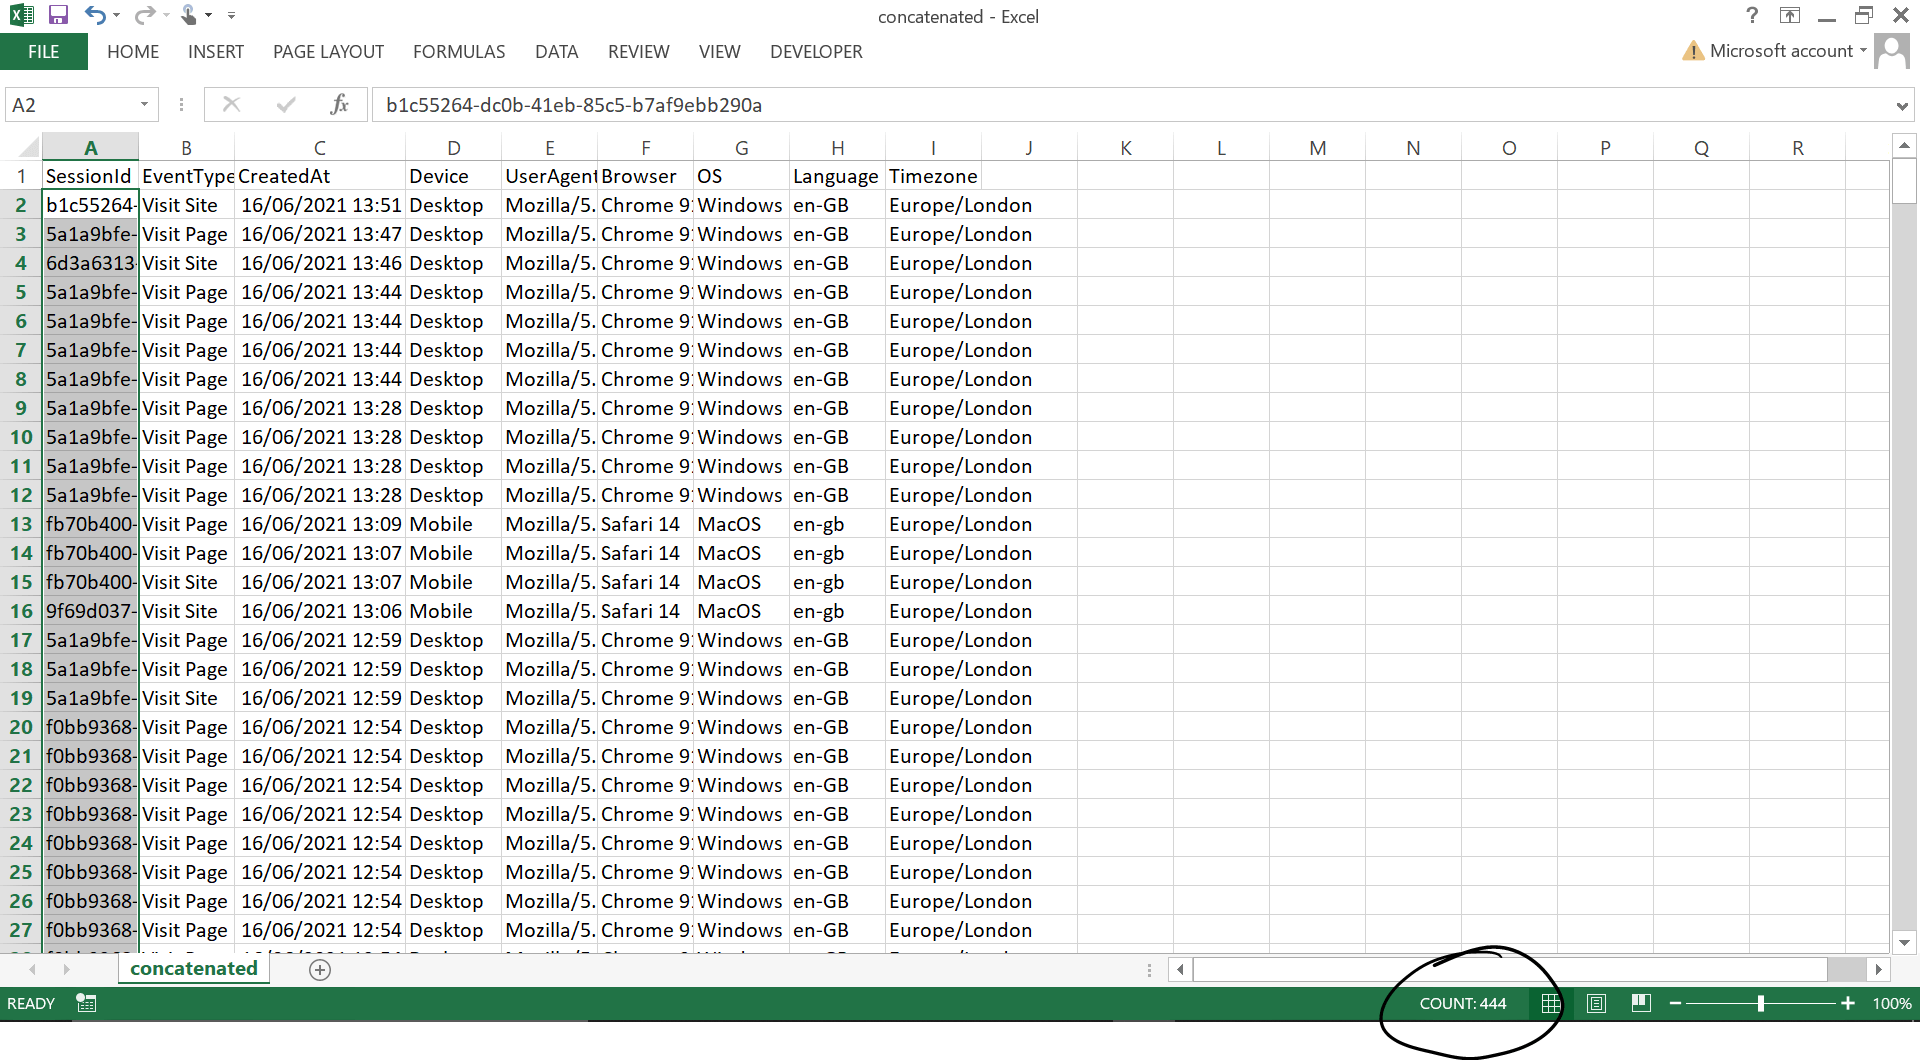
It might be hundreds of different CSV files that need bringing together! We can use Pandas concat to handle this. This script targets the 'logs' folder and stacks all 12 CSV files into one file. Each CSV has 37 rows, so after combining we should expect 444 rows.
import glob
import pandas as pd
from pandas.core.reshape.concat import concat

csv_files = glob.glob("logs/*.csv")
dataframes = []

for filename in csv_files:
  df = pd.read_csv(filename, index_col=None, header=0)
  dataframes.append(df)

concatenated_df = pd.concat(dataframes, axis=0, ignore_index=True)
print(concatenated_df.shape)

concatenated_df.to_csv(f"logs/concatenated.csv", index=False)
Now all files have been saved to the 'logs' folder in the file 'concatenated.csv' which we can see in the image below. Perfect! This is a super fast way to bring similar but dispersed datasets together and 'stack' them on top of one another. The main thing your source files need, are to all have the same column names so they all align whilst concatenating.
A similar option is to use Pandas append, however my understanding is concat is faster as the append method will add rows of the second dataframe to the first dataframe iteratively one at a time. However, the concat function will do a single operation, which makes it faster than append.
What we learned
Using Pandas merge brings the power of SQL database-style joins to Excel, it gives you many more options than an index match ever could and with greater simplicity and scalability. We can also lookup rows and values by given criteria using loc and easily 'stack' data from many files using concat. In my opinion, it's essential to keep each on your Data Science toolbelt as you never known when you'll need them!
As always, if you have any questions leave a comment in the comments section, or use the contact button at the bottom of the page to get in touch. You can download all of the code and files used in this article to try things out yourself.
I hope this article helped you out. If you enjoyed this article be sure to check out: