Creating your own website analytics solution with AWS Lambda and Google Sheets
After creating and launching this site, I needed a way to capture some simple usage statistics. Although I could have used Google Analytics, which is free, the mantra of “if the product is free, then you are the product” was at the back of my mind. After reading other articles like roll your own analytics and logging sensor data to Google Sheets via AWS Lambda I was inspired to give it a go.
So for this setup I wanted:
- No third party tracking
- Free or very low cost
- Serverless
- Low maintenance
- No bloat for fast page load
- Completely anonymous data
- Only useful data collected - visitors, page views etc
- No personal data collected
- No cookies and no cookie banner
- A simple dashboard to present the analytics
I know what you’re thinking, why not use Google Analytics when you’re using Google Sheets anyway? Well, my opinion is that the Google Sheet is my own data, controlled by me. The alternative is capturing lots of information I don’t need - bloating the page load time alongside placing tracking and ad cookies on users devices. I’m not against Google Analytics but because many sites use it, and Google runs on advertising, it gives it a powerful position - and let’s face it most users (including myself sometimes) are quick to click that ‘Accept cookies’ button without realising just how much tracking they are subjected to. However, I am impressed by the opt-out browser add on offered by Google which prevents any data being sent to Google Analytics.
The plan for how it would work looked like this:
- Collect events in state as the user browses the site
- The user ends their browsing session
- Events data is sent to AWS Lambda function
- AWS Lambda function writes the data to a Google Sheet
- The Google Sheet acts as the database
- Consume the Google Sheet into a dashboard tool like Power BI Desktop
- Build the analytics dashboard
To determine when to send the analytics events to the AWS Lambda function, I will be adding event listeners to my Vue web app. They will listen for the pagehide, beforeunload, and unload events, alongside visibilitychange and blur to handle mobile closing or switching tabs, particularly on iOS.
Setting up the infrastructure
In the video below I replicate the setup to demo how the solution is put together. Creating a Lambda Layer is not covered in the video but I cover it in the section following the video. The step by step actions are:
- Create a Google Cloud project
- Enable the Google Sheets and Google Drive APIs for the project
- Create a service account
- Create credentials for the service account
- Create and share Google Sheet with service account email
- Create AWS Lambda function
- Add a Layer to AWS Lambda function for the gspread package
- Create AWS API Gateway to call function
- Call the API endpoint with Postman to test it
When creating the AWS Lambda function, I added a file google_service_account_credentials.json and pasted in the json from the generated service account credentials. This allows the function to use the gspread Python package to read and write to the Google Sheet. I also shared the Google Sheet with the service account email to ensure it had permission to access it.
AWS Lambda function
import json
import gspread

def lambda_handler(event, context):
    request_body = json.loads(event["body"]) if type(event["body"]) is str else event["body"]
    write_events_to_google_sheet(request_body["events"])

    return { "statusCode": 200 }


def write_events_to_google_sheet(events):
    gc = gspread.service_account(filename='google_service_account_credentials.json')
    gsheet = gc.open("Website Analytics")

    for event in events:
        row = [
            event["sessionId"],
            event["eventType"],
            event["createdAt"],
            event["device"],
            event["userAgent"],
            event["browser"],
            event["os"],
            event["language"],
            event["timezone"],
            event["path"]
        ]

        gsheet.sheet1.insert_row(row, index=2)

    print(
        str(len(events)) + " events logged to the Google Sheet."
    )
Data used to test function
{
  "body": {
    "events": [
      {
        "sessionId": "2d885afe-dece-4d1e-829f-e08c305ab32d",
        "eventType": "visit-site",
        "createdAt": "01-01-2021 09:21:11",
        "device": "Desktop",
        "userAgent": "Chrome",
        "browser": "Safari",
        "os": "MacOS",
        "language": "en-GB",
        "timezone": "London-GMT",
        "path": "/"
      },
      {
        "sessionId": "2d885afe-dece-4d1e-829f-e08c305ab32d",
        "eventType": "visit-page",
        "createdAt": "01-01-2021 09:41:11",
        "device": "Desktop",
        "userAgent": "Chrome",
        "browser": "Safari",
        "os": "MacOS",
        "language": "en-GB",
        "timezone": "London-GMT",
        "path": "/blog/article-1"
      },
      {
        "sessionId": "2d885afe-dece-4d1e-829f-e08c305ab32d",
        "eventType": "visit-page",
        "createdAt": "01-01-2021 09:31:11",
        "device": "Desktop",
        "userAgent": "Chrome",
        "browser": "Safari",
        "os": "MacOS",
        "language": "en-GB",
        "timezone": "London-GMT",
        "path": "/blog/article-2"
      },
      {
        "sessionId": "2d885afe-dece-4d1e-829f-e08c305ab32d",
        "eventType": "visit-page",
        "createdAt": "01-01-2021 09:51:11",
        "device": "Desktop",
        "userAgent": "Chrome",
        "browser": "Safari",
        "os": "MacOS",
        "language": "en-GB",
        "timezone": "London-GMT",
        "path": "/about"
      }
    ]
  }
}
Adding a Layer
You may have seen I added a Layer to the function so it had access to the gspread package (and it’s dependencies) for interacting with the Google Sheet. This video covers adding a Layer nicely but my steps were:
- Open command prompt
- Create a folder using
mkdir python - Install package and dependencies to the folder using
pip install gspread -t . - Zip the python folder in file explorer
- Go to AWS Lambda Layers (Image A below)
- Create a new Layer and upload your zip file (Image B below)
- You can now use that Layer with any function


Now that the function is receiving data and writing it to the Google Sheet, the main thing to focus on now, is actually capturing events data in the Vue app to send to it. We’ll explore how I did that in the following section.
Capturing and logging events in Vue
Since I was using Nuxt with Vue, I stored the events in the top level default.vue component state. I did consider using Vuex but this approach worked well. As the user browses the site and the page changes, the logVisitPageOnRouteChange method saves the events in the analyticsEvents array. Within the mounted hook, I listen for a number of exit events such as beforeunload and pagehide. This means whenever a user switches tabs, closes the tab, closes the browser, switches to another app on mobile or just visits another site, the sendAnalyticsData method is fired. This logs all the events currently stored in state to the AWS Lambda function, then clears the state to ensure it never logs duplicate records.
<template>
  <div>
    <Navbar />
    <div class="container main-content mt-6 pt-4">
      <nuxt />
    </div>
    <Footer />
  </div>
</template>

<script>
import Navbar from "~/components/Navbar";
import Sidebar from "~/components/Sidebar";
import Footer from "~/components/Footer";
import identifyBrowser from "~/utils/identifyBrowser";
import { v4 as uuidv4 } from "uuid";

export default {
  components: {
    Navbar,
    Sidebar,
    Footer,
  },
  data() {
    return {
      uuid: null,
      sendingAnalyticsData: false,
      analyticsEvents: [],
    };
  },
  mounted() {
    this.uuid = uuidv4();
    this.listenForAllExitEvents();
    this.logVisitSiteEvent();
    this.logVisitPageOnRouteChange();
  },
  methods: {
    listenForAllExitEvents() {
      window.addEventListener("pagehide", this.sendAnalyticsData);
      window.addEventListener("beforeunload", this.sendAnalyticsData);
      window.addEventListener("unload", this.sendAnalyticsData);
      document.addEventListener("visibilitychange", this.sendAnalyticsData);
      if (this.iOS()) window.addEventListener("blur", this.sendAnalyticsData);
    },
    sendAnalyticsData() {
      let url =
        "https://f2hrck8yp5.execute-api.eu-west-1.amazonaws.com/website-analytics-logger-demo";
      let data = JSON.stringify({ events: [...this.analyticsEvents] });

      if (!this.sendingAnalyticsData) {
        this.sendBeacon(url, data);
      }
    },
    sendBeacon(url, data) {
      if (this.analyticsEvents.length > 0) {
        console.log("Sending analytics data");
        this.sendingAnalyticsData = true;

        if (
          window.navigator.sendBeacon ||
          (window.navigator.sendBeacon && document.visibilityState == "hidden")
        ) {
          const beacon = window.navigator.sendBeacon(url, data);
          this.analyticsEvents = [];
          this.sendingAnalyticsData = false;
          console.log("Analytics data sent and cleared from state");
          if (beacon) return;
        }

        const { vendor } = window.navigator;

        const async = !this.iOS();
        const request = new XMLHttpRequest();
        request.open("POST", url, async); // 'false' makes the request synchronous
        request.setRequestHeader("Content-Type", "application/json");
        request.send(data);

        if (!async || ~vendor.indexOf("Google")) return;

        const t = Date.now() + Math.max(300, latency + 200);
        while (Date.now() < t) {
          // postpone the JS loop for 300ms so that the request can complete
          // a hack necessary for Firefox and Safari refresh / back button
        }

        this.analyticsEvents = [];
        this.sendingAnalyticsData = false;
        console.log("Analytics data sent and cleared from state");
      }
    },
    iOS() {
      return (
        [
          "iPad Simulator",
          "iPhone Simulator",
          "iPod Simulator",
          "iPad",
          "iPhone",
          "iPod",
        ].includes(navigator.platform) ||
        (navigator.userAgent.includes("Mac") && "ontouchend" in document)
      );
    },
    logVisitPageOnRouteChange() {
      this.$router.beforeEach((to, from, next) => {
        let visitPageEvent = {
          sessionId: this.uuid,
          eventType: "Visit Page",
          createdAt: this.getCurrentDateTime(),
          device: this.isMobileDevice() ? "Mobile" : "Desktop",
          userAgent: navigator.userAgent,
          browser: identifyBrowser(),
          os: this.getOSName(),
          language: navigator.language,
          timezone: Intl.DateTimeFormat().resolvedOptions().timeZone,
          path: to.path === "/" ? to.path : to.path.replace(/\/$/, ""),
        };

        this.analyticsEvents.push(visitPageEvent);
        next();
      });
    },
    logVisitSiteEvent() {
      let visitSiteEvent = {
        sessionId: this.uuid,
        eventType: "Visit Site",
        createdAt: this.getCurrentDateTime(),
        device: this.isMobileDevice() ? "Mobile" : "Desktop",
        userAgent: navigator.userAgent,
        browser: identifyBrowser(),
        os: this.getOSName(),
        language: navigator.language,
        timezone: Intl.DateTimeFormat().resolvedOptions().timeZone,
        path:
          window.location.pathname === "/"
            ? window.location.pathname
            : window.location.pathname.replace(/\/$/, ""),
      };

      this.analyticsEvents.push(visitSiteEvent);
    },
    getCurrentDateTime() {
      let currentDate = new Date();
      return (
        currentDate.getDate() +
        "/" +
        (currentDate.getMonth() + 1) +
        "/" +
        currentDate.getFullYear() +
        " " +
        currentDate.getHours() +
        ":" +
        currentDate.getMinutes() +
        ":" +
        currentDate.getSeconds()
      );
    },
    isMobileDevice() {
      return (
        typeof window.orientation !== "undefined" ||
        navigator.userAgent.indexOf("IEMobile") !== -1
      );
    },
    getOSName() {
      var OSName = "Unknown OS";
      if (navigator.appVersion.indexOf("Win") != -1) OSName = "Windows";
      if (navigator.appVersion.indexOf("Mac") != -1) OSName = "MacOS";
      if (navigator.appVersion.indexOf("X11") != -1) OSName = "UNIX";
      if (navigator.appVersion.indexOf("Linux") != -1) OSName = "Linux";

      return OSName;
    },
  },
};
</script>
There are many helper methods in this component, mostly for identifying things like the browser, timezone, language and OS. To handle switching tabs or apps on mobile I added the visibilitychange exit listener. This was very effective in capturing events from iOS devices, which proved tricky at first until I read more on the topic. I took inspiration from the article roll your own analytics for the sendBeacon implementation. I used the uuid package to generate a random identifier so it persists over tab switching, but not refreshing the page or closing the browser - no cookies, privacy first approach.
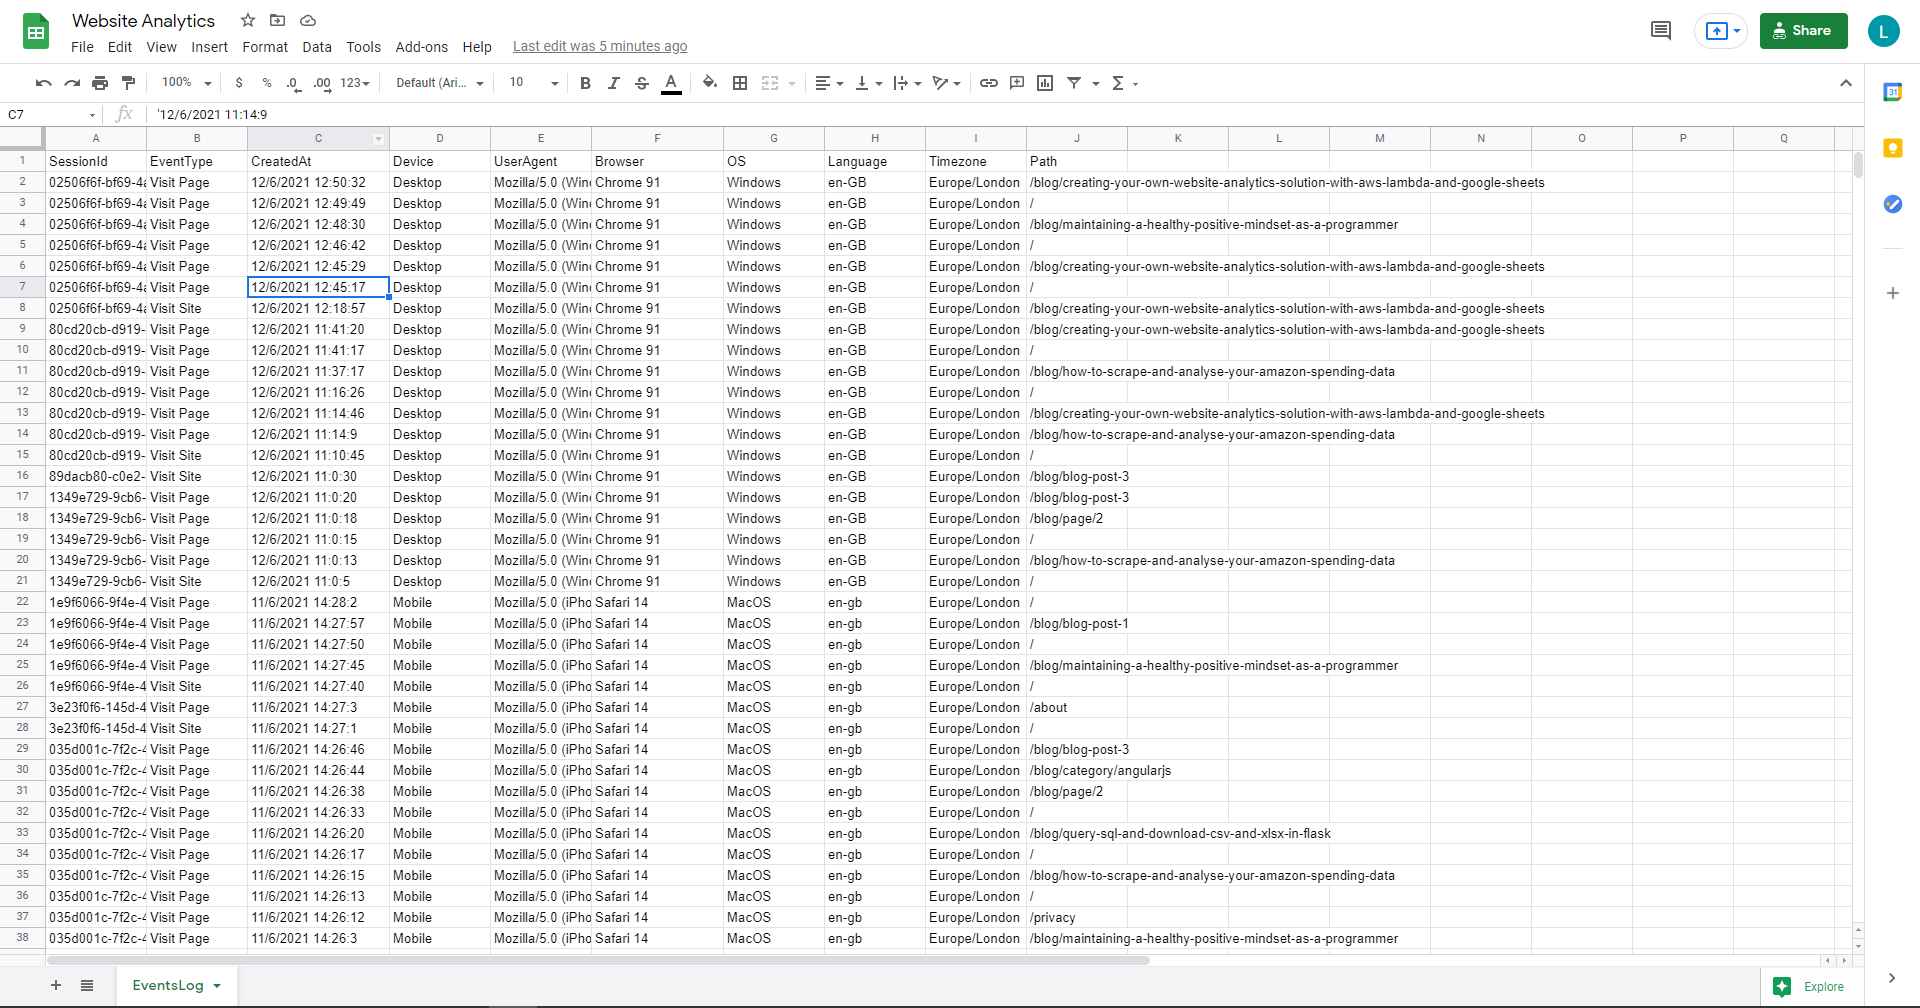
Here is my Google Sheet after sending through quite a bit of test data by interacting with the site.
Presenting the data in a dashboard
Now data is coming in from the Vue app, I needed a way to make sense of it in some form of dashboard. I chose to build an analytics dashboard using Power BI Desktop. It is free to download, fairly quick to create a dashboard and lots of support online to get started.
You can get data from your Google Sheet by following these steps:
- Go to the Google Sheet
- Click Share
- Get a link as share with anyone
- Change URL ending
/edit?usp=sharingto/export?format=xlsx - Open Power BI and select get data from Web
- Paste in the share link
- Select the name of your sheet and Power BI will load it as a table
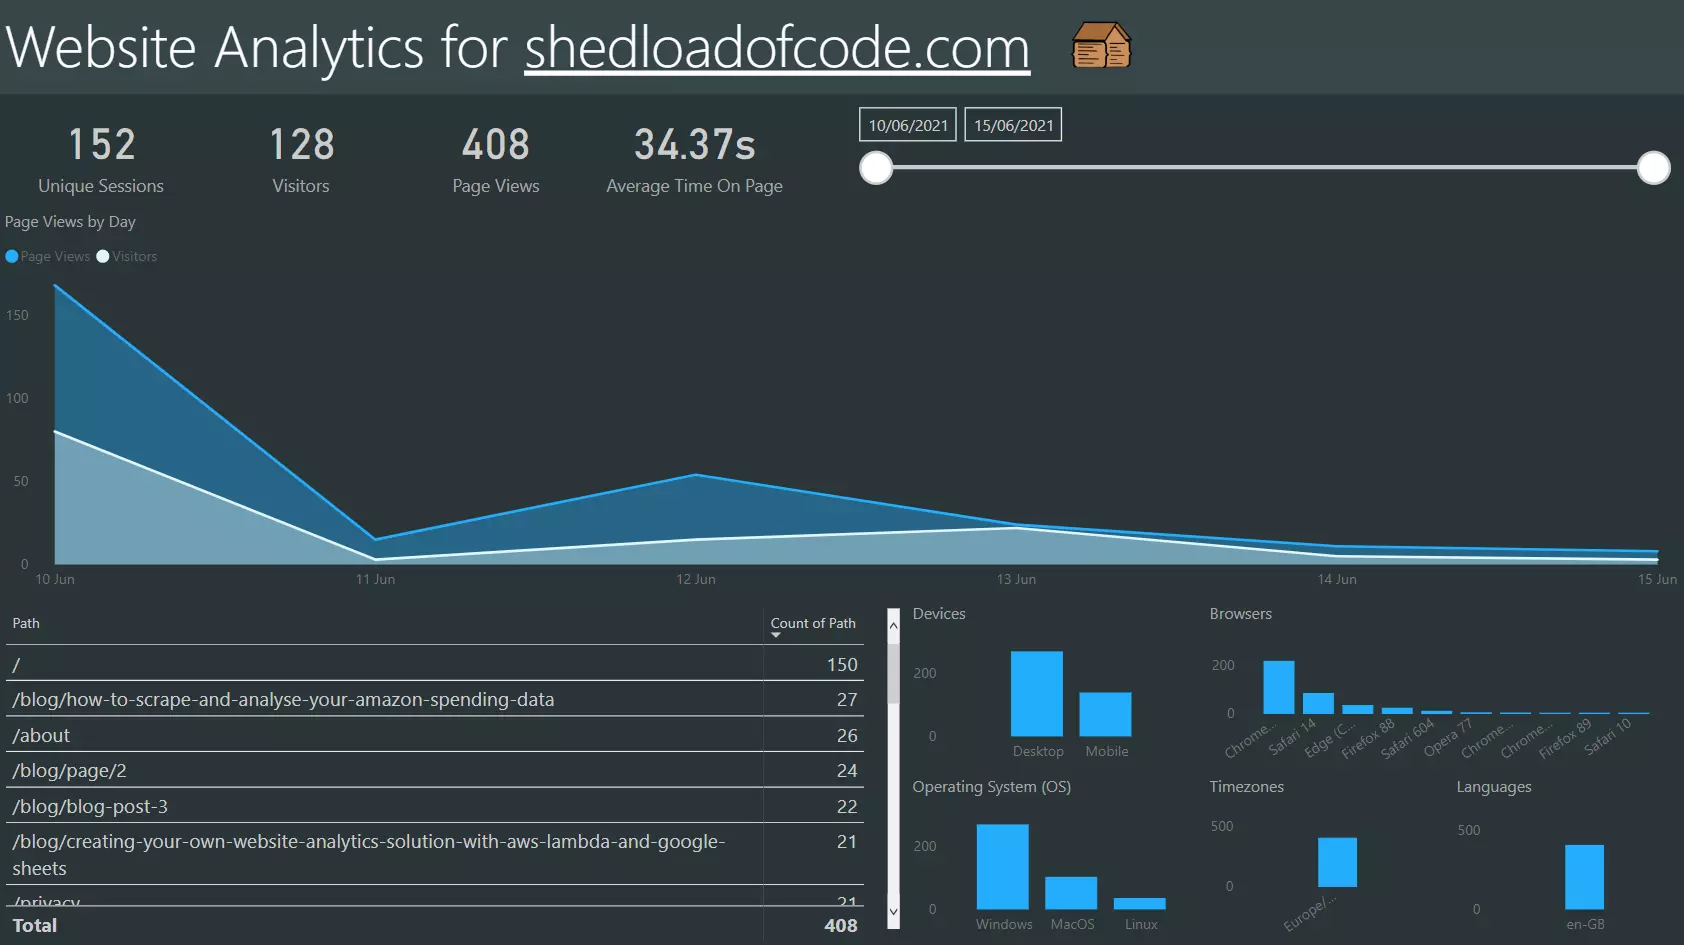
There are many other ways to present the data held in Google Sheets, use whichever tool you like the most. This is what my dashboard looks like with test data:

It’s simple, straightforward and easy to read. It provides all the high level and detailed information I need to see how well the site is being received, which pages are popular, and which need more work. As the data is automatically logged to the Google Sheet, all I need to do to receive the most up to date data in the Power BI dashboard is hit the Refresh button. The styling might not be amazing, but it’s for my eyes only, I’m not out to win any style awards 😆. The most important part for me, is that I'm only capturing the data I need, without any third party tracking or cookies. It's a privacy first approach. There is no personal data collected, it's all anonymous aggregated data.
There was some DAX involved to create calculated columns and measures for the average time on page calculation. I have covered the entire process for building this dashboard from scratch in the article building a website analytics dashboard with Power BI and Google Sheets.
Bonus: Avoid tracking your own activity
As I tested and interacted with the site myself, I didn't want to track my own activity. During the site launch, I didn't want any logs of testing activity either. This would skew the usage statistics and create an inaccurate picture. I addressed this by adding a private route for internal users that saved a value in local storage then redirected back to the home page. So for any internal testing, we can use the private route URL to deactivate analytics logging.
<template></template>

<script>
export default {
  mounted() {
    localStorage.setItem("analyticsDeactivated", true);
    window.location.href = "/";
  }
};
</script>
Once this value is set, I added a guard just before the sendBeacon method is called. So if analytics are set to deactivated, the events data won't be sent.
sendAnalyticsData() {
  let url =
    "https://f2hrck8yp5.execute-api.eu-west-1.amazonaws.com/website-analytics-logger-demo";
  let data = JSON.stringify({ events: [...this.analyticsEvents] });
  let analyticsDeactivated = localStorage.getItem("analyticsDeactivated") || false;

  if (!this.sendingAnalyticsData && !analyticsDeactivated) {
    this.sendBeacon(url, data);
  }
}
Lessons learnt
This has been a fun project and overall I’m pleased with the outcome. Does it give me an insight into visitors and page views? Absolutely. It’s not perfect, there are some negatives but it meets most of my initial goals. I did find it difficult to handle mobile use cases such as switching tabs, closing tabs, leaving the browser and switching to another app. This was overcome with the visibilitychange and blur events - effectively creating a ‘log when you can’ approach. Whenever the sendBeacon method is successfully called I clear the analyticsEvents array held in state, so if it happens to try and send again when a user comes back, it won’t send if there are no new events to log 😄
Although I acknowledge I will be missing some sessions, I am happy with that. I only set out to get a simple overview of how the site is being received so I can improve it. This satisfies that purpose nicely. If capturing every single event was the number one priority, I would switch this setup to log each event as it happens - using the beforeEach() hook to call the AWS function on each page change rather than all in one call at the end of the session. This would lead to increased AWS function calls which would increase the costs at scale. The AWS Lambda free usage tier includes 1M free requests per month and 400,000 GB-seconds of compute time per month at the time of writing.
I can see uses for this setup beyond website analytics logging. I think it could be handy in a variety of situations when it comes to logging information. If you have adapted this setup to your own needs, I'd love to hear about it in the comments below.
How it’s performed
I will update this section when more data on performance is available.