How to scrape and analyse your Amazon spending data
Ever wondered just how much you've spent on Amazon since signing up? Well I read an article recently from Dataquest which outlined how to find out how much you've spent on Amazon. However, I quickly found out that this feature of downloading your spending in a report, is not available on the UK version of this site! I really wanted to gather this data, and started a small project to do just that. So, if you're interested in gathering and analysing your Amazon spending data with Python, while learning some web scraping, you're in the right place.
Before starting
Before starting you will need a few things. These things will set you up to carry out other Data Science projects in the future too.
- Anaconda
- Jupyter Notebooks (installed with Anaconda)
- Selenium
- Google Chrome (latest version)
- Chrome Driver (latest version)
This article will not cover installing programs in detail, but here is a starting point. Install Anaconda first. Anaconda is a distribution of the Python and R programming languages for scientific computing (data science, machine learning applications, large-scale data processing, predictive analytics, etc.), that aims to simplify package management and deployment. Once installed, open Anaconda Prompt and install Selenium using pip install selenium. Selenium is a web driver built for automated actions in the browser and testing. Finally, ensure you have the latest version of Google Chrome installed and ChromeDriver for the version number of Chrome you're running. On Windows, ensure chromedriver.exe is in a suitable location such as C:\Windows.
There is a link to download the Jupyter Notebook at the end of this article so you can try out the code on your own. Alternatively, just use the code you find in this page if you don't want to use Anaconda and Jupyter Notebooks, and install the required Python packages in a virtual environment.
What will the web scraper do?
Here are the step by step actions the web scraper will perform to scrape Amazon spending data:
- Launches a Chrome browser controlled by Selenium
- Navigates to the Amazon login page
- Waits 30 seconds for you to manually log in
- After login, navigates to the Orders page
- Scrapes Item Costs, Order IDs, and Order Dates
- Repeats for each year in the year filter and each page in the pagination filter until finished
- Outputs the data model to a CSV file


The result will be enough to answer questions such as:
- How much have I spent in total?
- How much do I spend on average per order?
- What were the most expensive orders?
- What is my spending like per day of the week, month, year?
Before we step into the code, let's take a look at the automated scraper in action. Pay attention to the &orderFilter= and &startIndex= parameters in the URL bar. I've blurred out personal details of course, but you'll see how the scraper moves from year to year, and then page to page to scrape all of the order data.
Scraping the data
Let's look at the AmazonOrderScraper class which will be center stage. Bear in mind, this script was accurate at the time of writing, however if the Amazon website changes (id or class names, page structure or url paths) this script may no longer work and will require amending. Underneath this fairly long snippet you can simulate running the code to understand what it's doing, and what the final dataframe would look like.
import numpy as np
import pandas as pd
from bs4 import BeautifulSoup
import time

from selenium import webdriver
from selenium.webdriver.common.keys import Keys
from selenium.webdriver.chrome.options import Options
from selenium.webdriver.chrome.service import Service
from webdriver_manager.chrome import ChromeDriverManager

class AmazonOrderScraper:

    def __init__(self):
        self.date = np.array([])
        self.cost = np.array([])
        self.order_id = np.array([])


    def URL(self, year: int, start_index: int) -> str:
        return "https://www.amazon.co.uk/gp/your-account/order-history/" + \
                "ref=ppx_yo_dt_b_pagination_1_4?ie=UTF8&orderFilter=year-" + \
                str(year) + \
                "&search=&startIndex=" + \
                str(start_index)


    def scrape_order_data(self, start_year: int, end_year: int) -> pd.DataFrame:
        years = list(range(start_year, end_year + 1))
        driver = self.start_driver_and_manually_login_to_amazon()

        for year in years:
            print(f"Scraping order data for { year }")

            driver.get(
                self.URL(year, 0)
            )

            number_of_pages = self.find_max_number_of_pages(driver)

            self.scrape_first_page_before_progressing(driver)

            for i in range(number_of_pages):
                self.scrape_page(driver, year, i)

            print(f"Order data extracted for { year }")

        driver.close()

        print("Scraping done :)")

        order_data = pd.DataFrame({
            "Date": self.date,
            "Cost £": self.cost,
            "Order ID": self.order_id
        })

        order_data = self.prepare_dataset(order_data)

        order_data.to_csv(r"amazon-orders.csv")
        print("Data saved to amazon-orders.csv")

        return order_data


    def start_driver_and_manually_login_to_amazon(self) -> webdriver:
        options = webdriver.ChromeOptions()
        options.add_argument("--start-maximized")
        service = Service(executable_path=ChromeDriverManager().install())

        driver = webdriver.Chrome(service=service, options=options)
        # Alternatively, provide path to chromedriver using:
        # webdriver.Chrome("chromedriver.exe", options=options)

        amazon_sign_in_url = "https://www.amazon.co.uk/ap/signin?" + \
            "_encoding=UTF8&accountStatusPolicy=P1&" + \
            "openid.assoc_handle=gbflex&openid.claimed_id" + \
            "=http%3A%2F%2Fspecs.openid.net%2Fauth%2F2.0%2Fidentifier_select&" + \
            "openid.identity=http%3A%2F%2Fspecs.openid.net%2Fauth%2F2.0%2Fidentifier" + \
            "_select&openid.mode=checkid_setup&openid.ns=http%3A%2F%2Fspecs.openid" + \
            ".net%2Fauth%2F2.0&openid.ns.pape=http%3A%2F%2Fspecs.openid.net" + \
            "%2Fextensions%2Fpape%2F1.0&openid.pape.max_auth_age=0&openid" + \
            ".return_to=https%3A%2F%2Fwww.amazon.co.uk%2Fgp%2Fcss%2Forder-history" + \
            "%3Fie%3DUTF8%26ref_%3Dnav_orders_first&" + \
            "pageId=webcs-yourorder&showRmrMe=1"

        seconds_to_login = 30 # Allows time for manual sign in. Increase if you need more time
        print(f"You have { seconds_to_login } seconds to sign in to Amazon.")

        driver.get(amazon_sign_in_url)
        time.sleep(seconds_to_login)


        return driver


    def find_max_number_of_pages(self, driver: webdriver) -> int:
        time.sleep(2)
        page_source = driver.page_source
        page_content = BeautifulSoup(page_source, "html.parser")

        a_normal = page_content.findAll("li", {"class": "a-normal"})
        a_selected = page_content.findAll("li", {"class": "a-selected"})
        max_pages = len(a_normal + a_selected) - 1


        return max_pages


    def scrape_first_page_before_progressing(self, driver: webdriver) -> None:
        time.sleep(2)
        page_source = driver.page_source
        page_content = BeautifulSoup(page_source, "html.parser")
        order_info = page_content.findAll("span", {"class": "a-color-secondary value"})

        orders = []
        for i in order_info:
            orders.append(i.text.strip())

        index = 0
        for i in orders:
            if index == 0:
                self.date = np.append(self.date, i)
                index += 1
            elif index == 1:
                self.cost = np.append(self.cost, i)
                index += 1
            elif index == 2:
                self.order_id = np.append(self.order_id, i)
                index = 0


    def scrape_page(self, driver: webdriver, year: int, i: int) -> None:
        start_index = list(range(10, 110, 10))

        driver.get(
            self.URL(year, start_index[i])
        )
        time.sleep(2)

        data = driver.page_source
        page_content = BeautifulSoup(data, "html.parser")

        order_info = page_content.findAll("span", {"class": "a-color-secondary value"})

        orders = []
        for i in order_info:
            orders.append(i.text.strip())

        index = 0
        for i in orders:
            if index == 0:
                self.date = np.append(self.date, i)
                index += 1
            elif index == 1:
                self.cost = np.append(self.cost, i)
                index += 1
            elif index == 2:
                self.order_id = np.append(self.order_id, i)
                index = 0


    def prepare_dataset(self, order_data: pd.DataFrame) -> pd.DataFrame:
        order_data.set_index("Order ID", inplace=True)

        order_data["Cost £"] = order_data["Cost £"].str.replace("£", "").astype(float)
        order_data['Order Date'] = pd.to_datetime(order_data['Date'])
        order_data["Year"] = pd.DatetimeIndex(order_data['Order Date']).year
        order_data['Month Number'] = pd.DatetimeIndex(order_data['Order Date']).month
        order_data['Day'] = pd.DatetimeIndex(order_data['Order Date']).dayofweek

        day_of_week = {
            0:'Monday',
            1:'Tuesday',
            2:'Wednesday',
            3:'Thursday',
            4:'Friday',
            5:'Saturday',
            6:'Sunday'
        }

        order_data["Day Of Week"] = order_data['Order Date'].dt.dayofweek.map(day_of_week)

        month = {
            1:'January',
            2:'February',
            3:'March',
            4:'April',
            5:'May',
            6:'June',
            7:'July',
            8:'August',
            9:'September',
            10:'October',
            11:'November',
            12:'December'
        }

        order_data["Month"] = order_data['Order Date'].dt.month.map(month)

        return order_data


if __name__ == "__main__":
    aos = AmazonOrderScraper()
    order_data = aos.scrape_order_data(start_year = 2010, end_year = 2024)
    print(order_data.head(3))
Once instantiated as aos, we call the scrape_order_data method and it handles everything else. You will need to pass start_year and end_year as parameters to it, this allows for scraping the full range of years applicable to you, or a selected range.
I also recently used this script again in 2024, this time adding the webdriver-manager package to auto-install Chrome, avoiding having to find the correct version and provide the path to chromedriver.exe
I used similar methods to these in How to scrape AutoTrader with Python and Selenium to search for multiple makes and models.
Analysing the data
The prepare_dataset method applied some feature engineering to enhance the dataset. This is simply to ensure that the data is able to be sliced by date, year, month and day of the week. It carried out a series of data manipulation steps, such as removing the pound sign from the cost column, ensuring data types were correct, and mapping day and month names to their integer representations ready to use with charts.
So now you have your data, you can apply any analysis you would like to it. I will give you some inspiration on the kinds of questions you might wish to ask. You might find (like I did) your spending is higher or lower than you expected, so brace yourself for unexpected surprises!
Import packages
import numpy as np
import pandas as pd
import matplotlib.pyplot as plt
import seaborn as sns
sns.set(rc={'figure.facecolor':'white'})
Summary statistics
order_data.describe()
| Cost £ | Year | Month Number | Day | |
|---|---|---|---|---|
| count | 523.000000 | 523.000000 | 523.000000 | 523.000000 |
| mean | 18.695985 | 2015.139579 | 6.699809 | 2.797323 |
| std | 23.793675 | 3.276180 | 3.612417 | 2.164905 |
| min | 0.000000 | 2010.000000 | 1.000000 | 0.000000 |
| 25% | 5.330000 | 2012.000000 | 3.500000 | 1.000000 |
| 50% | 12.750000 | 2015.000000 | 7.000000 | 3.000000 |
| 75% | 23.015000 | 2018.000000 | 10.000000 | 5.000000 |
| max | 299.990000 | 2021.000000 | 12.000000 | 6.000000 |
Total spend
total_amount_spent = order_data["Cost £"].sum()
print(f"Total amount spent: £{ total_amount_spent }")
Average spend per order
average_amount_spent_per_order = order_data["Cost £"].mean()
print(f"Average amount spent per order: £{ round(average_amount_spent_per_order, 2) }")
Most and least expensive orders
order_data.loc[order_data["Cost £"] == order_data["Cost £"].max()]
| Order ID | Date | Cost £ | Order Date | Year | Day Of Week | Month |
|---|---|---|---|---|---|---|
| 205-1516165-1234567 | 31 March 2020 | 299.99 | 2020-03-31 | 2020 | Tuesday | March |
order_data.loc[order_data["Cost £"] == order_data["Cost £"].min()]
| Order ID | Date | Cost £ | Order Date | Year | Day Of Week | Month |
|---|---|---|---|---|---|---|
| 123-5616156-1234567 | 21 June 2011 | 0.0 | 2011-06-21 | 2011 | Tuesday | June |
Top five most expensive orders
order_data.sort_values(ascending=False, by="Cost £").head(5)
| Order ID | Date | Cost £ | Order Date | Year | Day Of Week | Month |
|---|---|---|---|---|---|---|
| 205-2452455-9123505 | 31 March 2020 | 299.99 | 2020-03-31 | 2020 | Tuesday | March |
| 204-4525421-7169117 | 15 November 2020 | 239.00 | 2020-11-15 | 2020 | Sunday | November |
| 205-5245215-9426706 | 28 February 2020 | 138.22 | 2020-02-28 | 2020 | Friday | February |
| 202-5278588-7857857 | 17 November 2018 | 135.99 | 2018-11-17 | 2018 | Saturday | November |
| 204-2542525-5654645 | 5 December 2020 | 127.37 | 2020-12-05 | 2020 | Saturday | December |
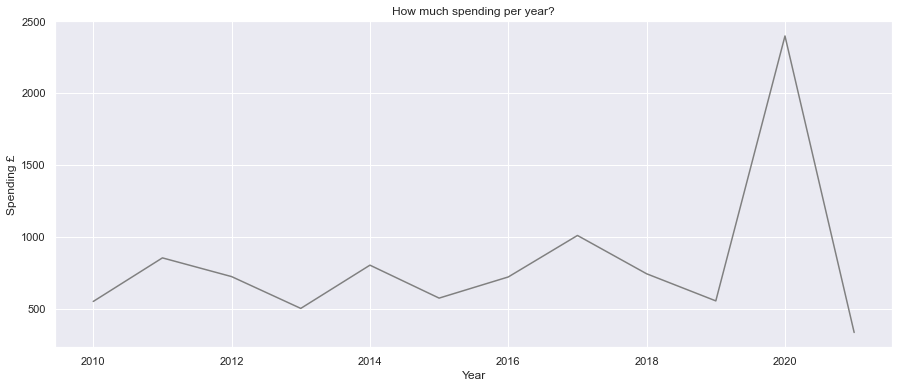
Total spend per year
fig, ax = plt.subplots(figsize=(15,6))
yoy_cost = order_data.groupby(["Year"], as_index=False).sum()
sns.lineplot(x=yoy_cost["Year"], y=yoy_cost["Cost £"], color="grey")
plt.title("How much spending per year?")
plt.ylabel("Spending £")
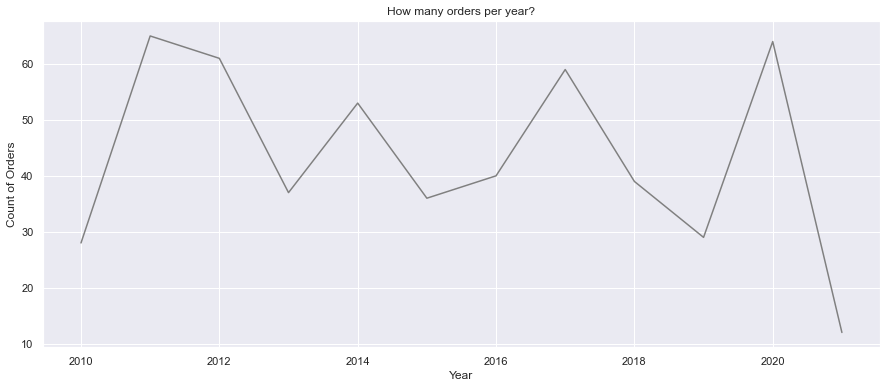
Count of orders per year
fig, ax = plt.subplots(figsize=(15,6))
yoy_order_count = order_data.groupby(["Year"], as_index=False).count()
sns.lineplot(x=yoy_order_count["Year"], y=yoy_order_count["Cost £"], color="Grey")
plt.title("How many orders per year?")
plt.ylabel("Count of Orders")
Total monthly spend
months = ["January", "February", "March", "April", "May", "June", "July", "August", "September", "October", "November", "December"]

fig, ax = plt.subplots(figsize=(15,6))
monthly_cost = order_data.groupby(["Month"], as_index=False).sum()
sns.barplot(x=monthly_cost["Month"], y=monthly_cost["Cost £"], order=months, color="Grey")
plt.ylabel("Spending £")
plt.title("How much overall spending per month?")

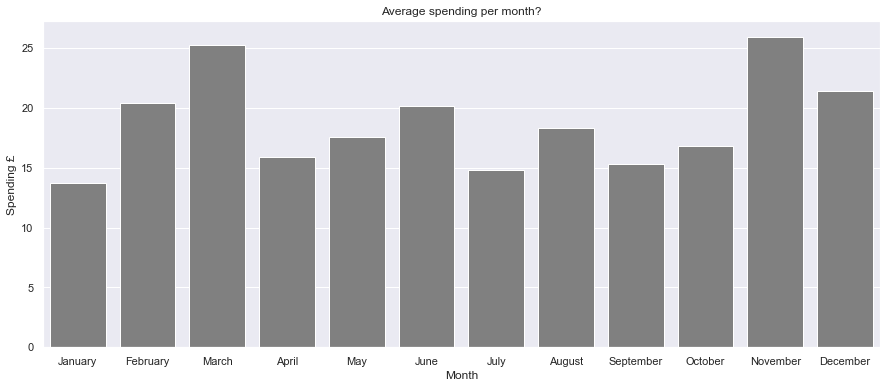
Average monthly spend
months = ["January", "February", "March", "April", "May", "June", "July", "August", "September", "October", "November", "December"]

fig, ax = plt.subplots(figsize=(15,6))
monthly_cost = order_data.groupby(["Month"], as_index=False).mean()
sns.barplot(x=monthly_cost["Month"], y=monthly_cost["Cost £"], order=months, color="Grey")
plt.ylabel("Spending £")
plt.title("Average spending per month?")
Day of the week with highest spend
days_of_week = ["Monday", "Tuesday", "Wednesday", "Thursday", "Friday", "Saturday", "Sunday"]

fig, ax = plt.subplots(figsize=(15,6))
day_of_week_cost = order_data.groupby(["Day Of Week"], as_index=False).sum()
sns.barplot(x=day_of_week_cost["Day Of Week"], y=day_of_week_cost["Cost £"], order=days_of_week, color="Grey")
plt.ylabel("Spending £")
plt.title("Which day of the week has the highest spend?")

Full time series
fig, ax = plt.subplots(figsize=(15,6))
sns.lineplot(x=order_data['Order Date'], y=order_data["Cost £"], color="Grey")
plt.ylabel("Spending £")
plt.title("Spending Time Series")

Final words and next steps
So there it is, you can now scrape and analyse your Amazon spending data using Python. Hopefully, the answers to the questions we've asked in this article haven't caused too many surprises! Now you have a way to monitor, track and analyse spending to identify trends. If there are any other analytical questions you'd like to ask of this dataset, let me know in the comments below and I'll update the article. The full Jupyter notebook can be downloaded for reference.
Ideas for future development might include importing the CSV into Power BI or other analysis tools. This would allow interactive data exploration and would introduce cross-filtering functionality. You could then cross examine day of the week with year, or day of the month with month and all other combinations. This could unlock further insights.